
How to build a DevOps pipeline?
Last updated
In production environments, an efficient build DevOps pipeline ensures that every code change is validated before it ever reaches users. It catches regressions early, enforces quality gates like security scans and test coverage, and pushes only verified artifacts to deployment environments. This is essential for scaling continuous integration and continuous delivery (CI/CD) workflows in fast-moving teams.
What is a DevOps pipeline?
A DevOps pipeline is a structured sequence of automated steps that takes code from version control to production. It is the backbone of CI CD pipelines used by modern engineering teams to ship features quickly and reliably. The pipeline automates critical tasks like building, testing, packaging, deploying, and monitoring. This allows teams to iterate faster without compromising stability.
Take a real-world scenario: a team commits a bug to main during peak hours. Without a proper CI CD pipeline, that bug goes live, triggers an incident, and forces a rollback under pressure. But with a well-architected pipeline, the bug would have failed a unit test or been flagged by a static analyzer before reaching production. This level of automation reduces incident frequency, improves MTTR, and builds confidence across engineering.
In mature organizations, pipeline rigor directly impacts system reliability, delivery speed, and security posture. It is not just a deployment tool. It is an operational control plane. Companies adopting high-quality pipelines report lower change failure rates, faster recovery from production issues, and significantly reduced delivery lead times.
The rest of this guide walks through each component of a modern DevOps pipeline, explains how to select the right pipeline tools, and shares actionable pipeline best practices to build a robust and observable delivery system. If you are designing or upgrading your pipeline architecture, start here.
What are DevOps pipeline stages?
A production-grade DevOps pipeline is a series of well-defined pipeline stages that validate, package, and promote code across environments. Each stage is responsible for isolating specific risks and enforcing quality controls. When implemented correctly, this structure supports high-velocity, low-risk software delivery.
1. Source control and build trigger
The pipeline begins with version control. Every commit to a repository triggers a new pipeline run. Most teams use Git-based systems like GitHub, GitLab, or Bitbucket. A push to a designated branch, such as main or release, typically triggers a CI job. This job validates the change through build and test workflows.
A sample trigger using GitHub Actions looks like this:
on:
  push:
    branches:
      - main
This ensures only changes merged to `main` initiate a full CI workflow. Teams often enforce branch protection rules that require all checks to pass before merging.
2. Build and compilation
The build pipeline compiles source code into artifacts. This includes resolving dependencies, packaging binaries, and producing container images. It must fail fast if the build environment is misconfigured or the code is broken.
For a Java application, a typical Maven step might look like this:
mvn clean package -DskipTestsFor container-based workflows, the pipeline usually builds a Docker image:
docker build -t my-app:${GITHUB_SHA} .A broken build should stop the pipeline immediately. This saves compute resources and surfaces issues early in the lifecycle.
3. Automated testing
The testing phase validates functionality, integration points, and edge cases. It often includes unit tests, integration tests, and static code analysis. Some teams extend this to UI testing and performance benchmarks.
Here’s an example using Pytest:
pytest tests/ --junitxml=results.xmlTests must be isolated, deterministic, and fast. A good practice is to parallelize tests by type. Unit tests run first, followed by integration and system-level tests. If any test fails, the pipeline should halt and report the failure.
4. Security and quality gates
Security scanning is integrated at this point. Static Application Security Testing (SAST), Software Composition Analysis (SCA), and container image scans are typical. Tools like Snyk, Trivy, or OWASP ZAP can be configured to run automatically.
For example, to scan a Docker image with Trivy:
trivy image my-app:${GITHUB_SHA}If high-severity vulnerabilities are found, the pipeline must fail and prevent the artifact from being promoted. This is critical for DevSecOps compliance.
5. Artifact management
Once tests and scans pass, the pipeline packages the result into an artifact. This is pushed to an artifact repository like Artifactory, Nexus, or a container registry such as Amazon ECR or GitHub Container Registry.
For Maven artifacts:
mvn deployFor Docker:
docker push my-app:${GITHUB_SHA}Storing artifacts as immutable versions ensures traceability and consistency between environments.

6. Deployment: staging and production
The deployment stage promotes the artifact to a live environment. This can be handled through scripts, infrastructure-as-code, or tools like Argo CD, Flux, or Spinnaker.
For Kubernetes-based teams using GitOps, a change to a deployment manifest in Git can trigger an automatic sync:
apiVersion: apps/v1
kind: Deployment
spec:
  template:
    spec:
      containers:
        - name: app
          image: my-app:${GITHUB_SHA}
Best practice is to deploy to staging first, run smoke tests or manual QA, and only then promote to production. Manual approval gates can be inserted here as policy controls.

7. Monitoring and feedback Loop
After deployment, the pipeline shifts to pipeline monitoring and observability. Metrics like error rate, latency, and resource usage are captured via tools like Prometheus, Datadog, or New Relic. Alerts should route to the correct team using tools like Zenduty.
This monitoring closes the loop. Operational signals feed back into the development cycle, improving future builds and tests. In case of failure, rollback procedures can be triggered automatically or on-demand using orchestration tools.
How to select tools at each stage of the DevOps pipeline?
Building a functional CI CD pipeline requires choosing tools that integrate cleanly at each stage. The selection should reflect your stack, team expertise, deployment targets, and security posture. While no toolchain fits all, the following breakdown covers widely adopted options that support scalable, resilient build pipelines.
Version control and CI orchestration
Every pipeline starts with version control. Git is the standard. Whether you use GitHub, GitLab, or Bitbucket, each provides native CI/CD orchestration features.
- GitHub Actions defines workflows in YAML files under `.github/workflows/`
- GitLab CI uses `.gitlab-ci.yml` to define pipeline jobs
- Bitbucket Pipelines integrates with `bitbucket-pipelines.yml`
Alternatively, standalone CI orchestrators like Jenkins, CircleCI, and Travis CI support deeper customization and more complex workflows.
Example GitHub Actions trigger:
on:
  push:
    branches:
      - main
Choose cloud-hosted systems for lower maintenance or self-hosted tools if you require custom runners, VPC isolation, or advanced secrets control.
Build tools
The build pipeline stage compiles source code and resolves dependencies. Your choice here is stack-dependent.
- Java: Maven, Gradle
- Node.js: npm, yarn
- Python: setuptools, pip
- C/C++: Make, CMake
- Polyglot systems: Bazel, especially in monorepos
- Containers: Docker
A typical Maven build:
mvn clean package -DskipTestsFor containerized apps:
docker build -t app:${GITHUB_SHA} .CI services usually support caching dependencies between runs. Always cache what can be reused to minimize build time.
Testing and security tools
Testing and static analysis tools run after a successful build. These should be consistent with what developers use locally, with extended coverage in CI.
- Unit tests: JUnit, pytest, Mocha, NUnit
- Integration/UI tests: Selenium, Cypress, Playwright
- Performance tests: JMeter, k6
- Security scans:
- SAST: SonarQube, CodeQL
- Dependency analysis: Snyk, OWASP Dependency-Check
- Container scanning: Trivy, Anchore
- Dynamic app testing: OWASP ZAP
Example: running Trivy on a Docker image
trivy image app:${GITHUB_SHA}Test failures and critical vulnerabilities should stop the pipeline. Use severity thresholds in scanners to enforce gates.
Artifact storage
Once validated, artifacts must be stored immutably for downstream deployment. This allows rollback and promotes consistency.
- General purpose: JFrog Artifactory, Sonatype Nexus
- Container images: Docker Hub, Amazon ECR, GitHub Container Registry
To push a Docker image:
# Login to registry first
echo ${{ secrets.GITHUB_TOKEN }} | docker login ghcr.io -u ${{ github.actor }} --password-stdin
# Then push
docker push ghcr.io/org/app:${GITHUB_SHA}
Artifact repositories support access control, retention policies, and audit trails. Use secure credentials management via CI secrets.
Deployment and release orchestration
Deployments vary by infrastructure. Match your tools to runtime and delivery strategy.
- Kubernetes-first:
- Argo CD, Flux (GitOps)
- Cloud CI/CD:
- AWS CodeDeploy, Azure Pipelines, Google Cloud Deploy
- Multi-service orchestration:
- Spinnaker, Harness
- Infrastructure provisioning:
- Terraform, Pulumi, CloudFormation
For GitOps via Argo CD, pushing a change to a Helm chart or Kustomize manifest triggers sync automatically. This provides auditability and rollback built into Git.
Pipeline monitoring and incident routing
Once deployments complete, the final stage is pipeline monitoring and feedback.
- Metrics: Prometheus, Datadog, New Relic
- Logs: ELK/EFK, Loki
- Alert routing: Zenduty
Zenduty provides fine-grained control over alert delivery, on-call schedules, and escalation policies. You can trigger alerts via webhook or native integration from CI tools.
Example alert routing in Zenduty:
{
  "message": "Production deploy failed",
  "priority": "high",
  "service": "CI Pipeline",
  "link": "https://ci.example.com/job/123"
}
This level of integration ensures pipeline failures become actionable incidents, not hidden noise.

Technical implementation patterns for DevOps pipelines
Designing a CI CD pipeline is not just about selecting the right tools. The structure and automation logic of the pipeline have to be reliable, testable, and repeatable. Mature teams treat pipelines as production-grade infrastructure, defining everything as code and enforcing consistency across environments.
Pipeline as code
Most modern systems support declarative pipeline definitions. This means versioning your pipeline config alongside application code. You gain reproducibility, auditability, and code review for delivery processes.
- GitHub Actions: .github/workflows/*.yml
- GitLab CI: .gitlab-ci.yml
- Jenkins: Jenkinsfile (Groovy DSL)
- Azure Pipelines: azure-pipelines.yml
Example: minimal GitHub Actions pipeline
name: CI
on:
  push:
    branches: [main]
jobs:
  build:
    runs-on: ubuntu-latest
    steps:
      - uses: actions/checkout@v2
      - name: Build and Test
        run: |
          npm ci
          npm run build
          npm test
This approach ensures your pipeline evolves with your application and supports standard code review workflows.
Infrastructure as Code (IaC) and environment consistency
Use Infrastructure as Code (IaC) tools to declare test, staging, and production environments. This guarantees parity across environments and avoids configuration drift.
- Provision infra: Terraform, CloudFormation, Pulumi
- Manage state and apply changes through your pipeline
- Use plan steps to detect changes before apply
Sample Terraform plan and apply in CI:
terraform init
terraform plan -out=tfplan
terraform apply tfplan
Combine IaC with containers and orchestration to ensure services behave identically across environments.
Trigger strategies and approval Gates
Trigger pipelines based on branch patterns, tags, or schedules. This gives precise control over when builds run and how deployments are promoted.
Examples:
- Push to main: trigger CI
- Tag matching v*.*.*: trigger release to production
- Nightly cron: run full regression suite
Insert approval steps for sensitive actions. Most systems support manual gates.
- GitLab: when: manual
- GitHub Actions: workflow_dispatch
- Jenkins: input step
Gate promotions to production with human approvals, especially in regulated or customer-facing systems.
Parallelism and dependency optimization
Speed matters. Optimize pipelines by breaking down stages and running jobs in parallel. Use caching to reduce redundant work.
- Fan-out/fan-in patterns: run independent jobs in parallel, then sync
- Cache builds, dependencies, and test results
- Shard large test suites by file or tag
Example GitHub Actions matrix for test parallelism:
strategy:
  matrix:
    shard: [1, 2, 3]
steps:
  - run: npm run test – --shard=${{ matrix.shard }}
Balance concurrency with infrastructure capacity. Monitor job queues and runner availability to avoid hidden bottlenecks.
Branching and environment mapping
Your Git strategy influences pipeline complexity. Align branches to environments for clear promotion flows.
- feature/*: run CI only
- main: deploy to staging
- release/*: deploy to production
Enforce required checks and pipeline completion before merges. For example, GitHub branch protection can block PRs until CI passes.
This setup supports continuous integration while maintaining safety in continuous delivery workflows.
Reusable configuration and templates
Avoid duplication across projects. Most CI/CD systems support reusable workflows or includes.
- GitHub Actions: composite actions, reusable workflows
- GitLab CI: include: directive for shared templates
- Jenkins: shared libraries
Centralize common logic like test runners, deploy jobs, or security scans. This improves consistency and speeds up onboarding for new services.
Pipeline observability and reliability
A well-functioning DevOps pipeline must be observable and resilient. This means tracking key metrics, logging every pipeline run, routing alerts effectively, and continuously improving based on operational feedback. Treat the pipeline as a first-class production system. If it breaks, your delivery process stalls. If it silently fails, bad code can reach production unnoticed.
Track key metrics
Measuring pipeline health is essential for optimizing performance and reliability. The four DORA metrics are foundational:
- Deployment Frequency: How often you release to production
- Lead Time for Changes: Time from code commit to deploy
- Change Failure Rate: Percentage of deployments that cause failures
- MTTR (Mean Time to Recovery): How quickly you recover from failures
In addition, monitor internal pipeline metrics:
- Pipeline duration: End-to-end time per run
- Failure rate: How often builds fail
- Test pass rate: Percentage of tests that succeed
- Build queue time: Delay between trigger and start
Tools like Prometheus, Datadog, and CI-native dashboards (e.g., GitHub Actions Insights) can expose these values.
Push custom metrics if needed:
echo "pipeline_duration_seconds 124" | curl --data-binary @- http://prometheus-pushgateway.example.com/metrics/job/pipelineBaseline these numbers and track deltas over time. Use anomalies to investigate regressions or resource constraints.
Logging and traceability
Every pipeline run should emit detailed logs. These logs must be retained, structured, and easily accessible for debugging and forensics.
Best practices:
- Tag logs with build ID, commit SHA, and pipeline name
- Upload artifacts like test results, coverage reports, and screenshots
- Link deployments to changelogs or commit diffs
- Store logs in a central system (e.g., ELK stack, Loki)
Example log annotation:
[DEPLOYMENT] service=payments env=prod version=1.2.3 sha=ab12cd started_at=2025-07-30T02:15ZThis allows on-call engineers to trace incidents back to specific changes quickly.
Alerting on pipeline failures
A broken CI CD pipeline should trigger actionable alerts. Silent failures lead to stale builds, delayed features, or undetected defects.
Alerting strategy:
- Route build failures for main, release/*, or prod deploys to the engineering team
- Use incident management tools like Zenduty to escalate critical alerts
- Enrich alerts with pipeline context: job name, commit SHA, logs link
Example Zenduty alert payload:
{
  "message": "Production deployment failed on service orders",
  "priority": "critical",
  "details": {
    "pipeline": "orders-prod-deploy",
    "commit": "d4e8f93",
    "logs": "https://ci.example.com/job/8234/console"
  }
}
Integrate alerting directly into your pipeline using webhooks or native plugins. Critical deploy failures should wake up the on-call SRE, not sit in a dashboard queue.

Feedback loops and postmortems
Use incidents and failed deployments as opportunities to harden the pipeline.
For every incident:
- Capture the root cause
- Identify gaps in tests, monitoring, or rollback strategy
- Add missing checks or validation to the pipeline
- Document findings and link them to changes in version control
Postmortem automation tools like Zenduty’s ZenAI can aggregate metrics, logs, and responder actions into a draft summary. This removes manual toil and ensures continuous improvement happens.
Sample postmortem summary:
Deployment of version 1.3.5 at 12:14 UTC caused 502 errors on checkout API.
Root cause: misconfigured service endpoint in Helm chart.
Rollback triggered at 12:28 UTC. Total impact: 14 minutes.
Action items: Add pre-deploy validation for Helm templates.
Automated rollbacks and resilience
Fast recovery is as important as fast deployment. Your deployment pipeline should support automated or manual rollback mechanisms.
Rollback options:
- Revert to previous artifact: Redeploy last known good build
- Blue-green deployments: Switch traffic between two isolated environments
- Canary releases: Gradually roll out and monitor
Sample rollback command in Kubernetes:
kubectl rollout undo deployment/web
Or trigger a rollback pipeline via CI:
jobs:
  rollback:
    runs-on: ubuntu-latest
    steps:
      - run: |
          ./scripts/deploy.sh --version=${{ inputs.previous_version }}
Always document rollback procedures and rehearse them during game days. Treat recovery paths as primary workflows, not afterthoughts.
Pipeline security and compliance
Security and compliance must be embedded directly into the CI CD pipeline. Delaying security checks until production invites risk and increases remediation costs. A secure build pipeline enforces policies, scans for vulnerabilities, and prevents unsafe changes from reaching runtime. The goal is to shift security left and apply automated controls at every stage.
Secrets management
Do not hardcode secrets in pipeline configuration or source code. Exposing tokens, credentials, or certificates can lead to unauthorized access or full system compromise.
Recommended practices:
- Use encrypted secret storage in your CI platform (e.g., GitHub Actions secrets, GitLab CI variables, Jenkins credentials store)
- Inject secrets as environment variables at runtime
- Use external secret managers for dynamic access: HashiCorp Vault, AWS Secrets Manager, Azure Key Vault
Example in GitHub Actions:
env:
  DATABASE_URL: ${{ secrets.DATABASE_URL }}
Mask secrets in logs and rotate them periodically. Apply the principle of least privilege to all secrets used by pipeline jobs.
Security scanning and enforcement gates
Embed security scanning as a mandatory stage in the pipeline. This includes static analysis, dependency scanning, and container image auditing.
Tools and integrations:
- Static Application Security Testing (SAST): CodeQL, SonarQube, Checkmarx
- Dependency Scanning (SCA): Snyk, OWASP Dependency-Check, Renovate
- Container Image Scanning: Trivy, Clair, Anchore
- Dynamic Analysis (DAST): OWASP ZAP against a deployed test environment
Configure your pipeline to fail if critical vulnerabilities are detected. Define severity thresholds in each tool. Use policy-as-code systems to enforce custom rules.
Continuous compliance and policy checks
Compliance requirements vary by industry. The pipeline should enforce required controls through automation.
Examples:
- Enforce license policies with tools like FOSSA or Licensee
- Apply tagging standards to infrastructure-as-code using OPA or Conftest
- Validate Terraform plans for compliance against CIS benchmarks
Example Conftest test:
deny[msg] {
  input.resource_type == "aws_s3_bucket"
  not input.encrypted
  msg = "S3 buckets must be encrypted"
}
Run compliance checks as a gated job before deploying infrastructure or services. This moves audit checks from manual reviews to continuous enforcement.
DevSecOps culture and visibility
Security is a team responsibility. Make scan results visible to developers and embed them in pull request reviews or CI dashboards. Prioritize actionable issues. Tune out low-value noise to avoid alert fatigue.
Recommendations:
- Include security findings in PR comments or pipeline summary output
- Set up dashboards for vulnerability trends per repo or service
- Perform threat modeling during planning for new services
Security checks should be non-negotiable but non-obstructive. Developers need to understand the purpose behind each gate and how to fix flagged issues efficiently.
Post-deployment security monitoring
Security does not stop at deploy. Include post-deployment checks and runtime monitoring as part of your pipeline monitoring strategy.
Use tools such as:
- Runtime vulnerability scanning: Wiz, Orca
- Intrusion detection systems (IDS): Falco, OSSEC
- Cloud Security Posture Management (CSPM): Prisma Cloud, Lacework
Integrate alerts from these tools back into your incident response system. If a post-deploy scan detects drift or a critical issue, trigger a rollback or incident automatically.
Example post-deploy trigger in pipeline:
jobs:
  post_deploy_scan:
    steps:
      - run: ./scripts/scan-runtime.sh
      - if: failure()
        run: ./scripts/trigger-rollback.sh
Security and compliance should be automated, enforced, and treated as engineering concerns. A secure DevOps pipeline protects not just your systems, but your users and your velocity. The more automated and visible your controls are, the easier it becomes to scale secure practices across the organization.
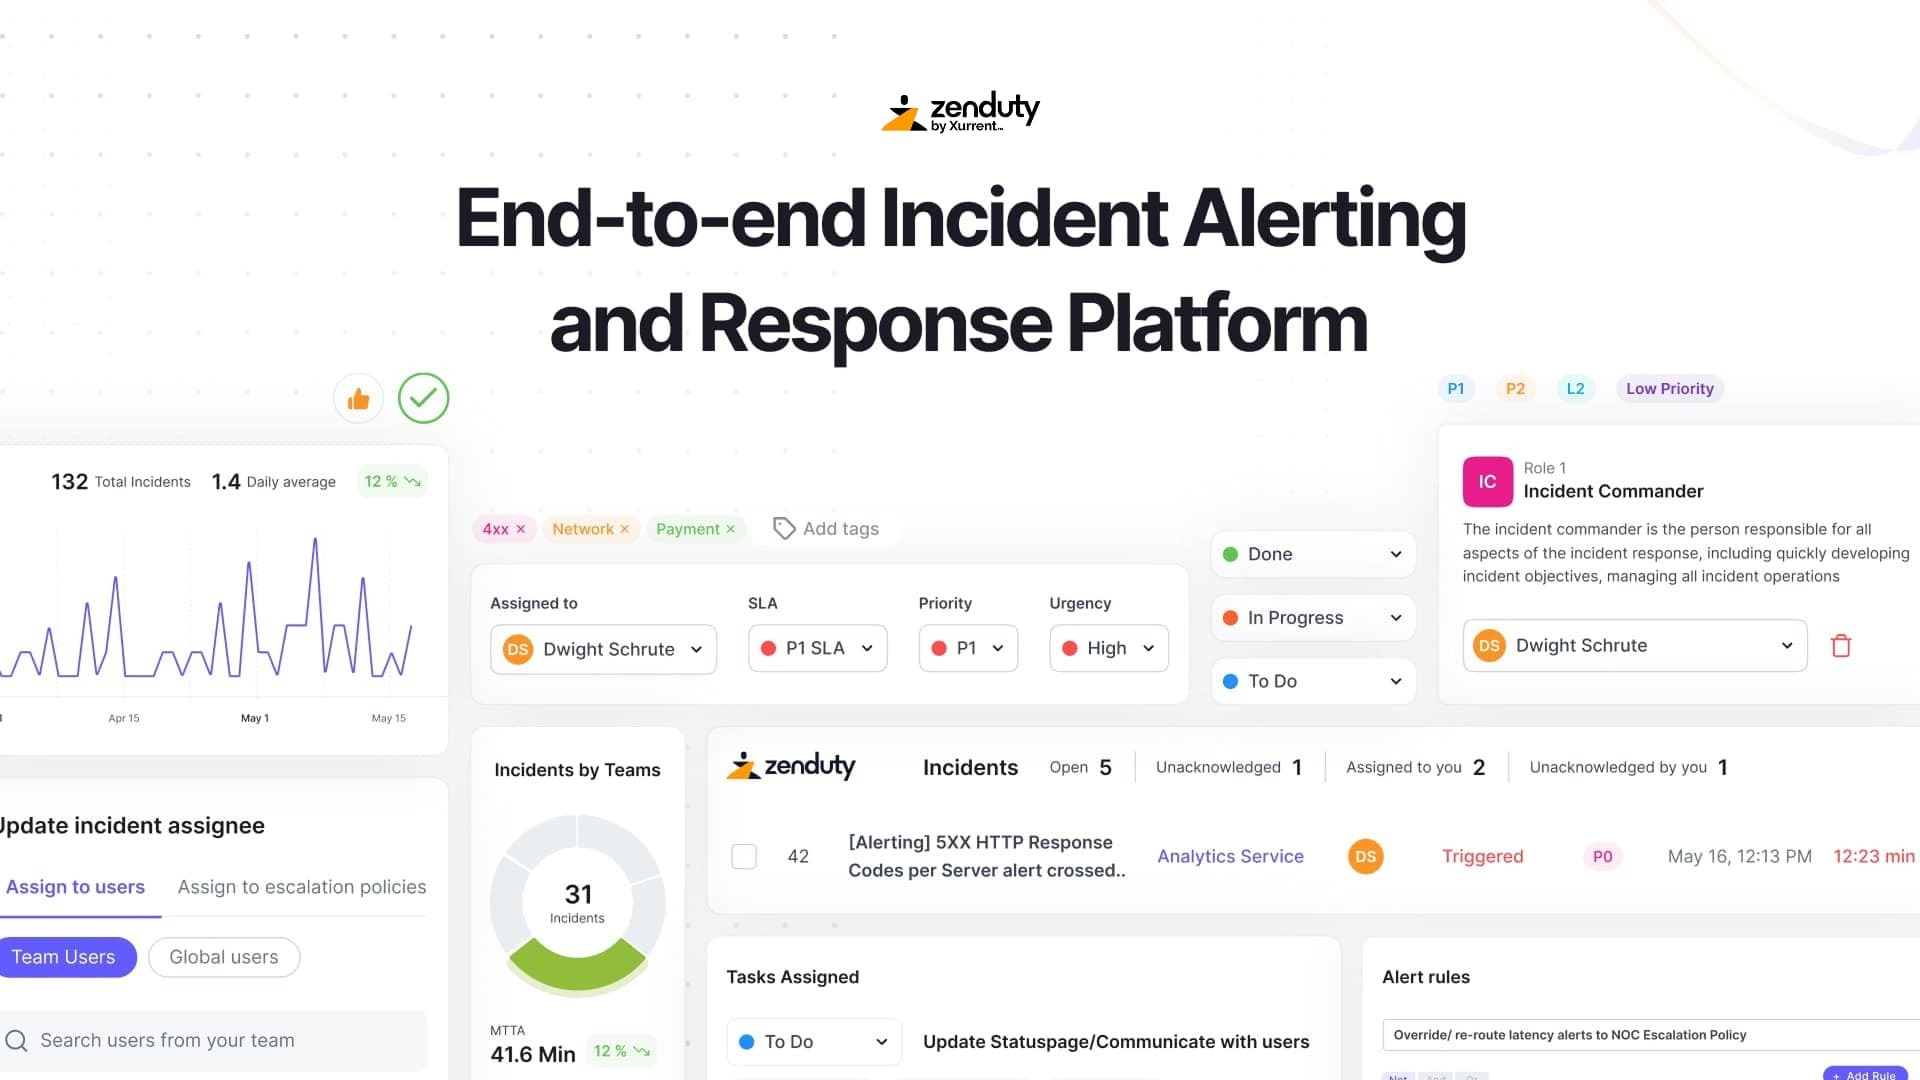
Zenduty integration for pipeline incident response
Even the most robust CI CD pipeline will experience failures. When a deployment breaks or a critical job fails, someone needs to be alerted immediately. Manual monitoring is not scalable. To operationalize your DevOps pipeline, you need automated incident routing tied directly into your CI system.
Routing pipeline failures as incidents
Zenduty acts as the incident response layer for your build pipeline. It integrates with CI/CD tools like Jenkins, GitHub Actions, GitLab CI, and Azure Pipelines through webhooks or native plugins. You define alert rules based on pipeline stage, job name, or failure reason.
For example, a GitHub Actions job can post a webhook to Zenduty:
- name: Notify Zenduty
  if: failure()
  run: |
    curl -X POST https://api.zenduty.com/api/v1/incidents/
    -H "Authorization: Token ${{ secrets.ZENDUTY_API_KEY }}"
    -H "Content-Type: application/json"
    -d '{
      "message": "Deploy failed for service payments",
      "priority": "critical",
      "service": "ci-pipeline",
      "details": {
        "job": "deploy-prod",
        "commit": "${{ github.sha }}",
        "logs": "https://github.com/org/repo/actions/runs/${{ github.run_id }}"
      }
    }'
Zenduty parses the alert and routes it to the correct team based on predefined escalation policies. No pipeline failure goes unnoticed or unresolved.
On- call schedule integration
Zenduty manages on-call schedules across teams. When a pipeline alert triggers an incident, it contacts the currently assigned on-call engineer through multiple channels.
Supported channels:
- Mobile push
- SMS
- Phone call
- Slack or Teams
Escalation happens automatically if the primary responder does not acknowledge. This ensures 24x7 coverage without manual intervention.
Zenduty also supports schedule management via its conversational AI, ZenAI. Engineers can update rotations using natural language. For example:
“Add @alice to the DevOps on-call next week.”
This reduces coordination overhead and keeps alert routing accurate.
Severity-based alert mapping
Not every pipeline failure requires a wake-up call. Use Zenduty to classify failures by severity and map them to appropriate workflows.
Examples:
- Failed build on a feature branch: notify team Slack channel
- Failed integration test on main: create a low-priority Zenduty incident
- Failed production deploy: trigger a high-priority incident and page the on-call SRE
Zenduty lets you enrich incidents with runbook links, affected services, and recent commits. This reduces time to action.
Sample payload with enrichment:
{
  "message": "Staging deploy failed on service auth",
  "priority": "high",
  "runbook": "https://docs.example.com/runbooks/auth-deploy-failure",
  "commit_range": "a12345..c67890",
  "logs": "https://ci.example.com/job/745/log"
}
Automated response and collaboration
Zenduty can trigger automated actions on incident creation. For example:
- Spin up a Slack incident channel
- Add responders automatically
- Open a Zoom bridge
- Create a Jira ticket for tracking
For known failure types, you can configure Zenduty to trigger a scripted rollback or restart the failed pipeline job.
This turns alerting into response orchestration. Engineers do not waste time setting up context. The tooling does it for them.
ZenAI-driven postmortems
After an incident, ZenAI compiles the timeline, contributing factors, and responder actions into a structured postmortem draft. This includes metrics, logs, and chat history. Engineers can refine the output or add action items.
Example auto-generated summary:
Incident: prod-deploy-failure-auth
Time: 04:21 UTC
Impact: deploy blocked for 19 minutes
Root Cause: Helm chart value missing required config key
Action Taken: rollback to v1.4.2
Resolution Time: 04:40 UTC
Next Steps: validate Helm templates pre-deploy
Zenduty stores these for audit and learning, and ties them back to incidents in your analytics dashboard.
Pipeline best practices and pitfalls to avoid
A DevOps pipeline is not a one-time setup. It evolves with your system and team. The strongest pipelines are fast, modular, and observable. The weakest ones are opaque, brittle, or overloaded. Here are hard-learned practices and common failure modes to avoid.
Automate everything, structure it well
Every pipeline step should be automated. Manual processes introduce delay and risk. Use scripts, configuration management, and APIs to eliminate human intervention. But avoid stuffing all logic into a single monolithic job. Structure the pipeline into discrete, purpose-built stages.
Example structure:
jobs:
  build:
    steps: [...]
  test:
    needs: build
    steps: [...]
  scan:
    needs: test
    steps: [...]
  deploy:
    needs: scan
    steps: [...]
This structure allows you to rerun failed stages independently and debug more effectively.
Fail fast, Fail loud
Configure the pipeline to stop as soon as a critical failure is detected. Do not waste time running downstream jobs after a broken build or failed security check. Make failures visible and noisy.
Recommendations:
- Use fail-fast behavior in CI runners
- Post alerts to team channels on failure
- Block merges until pipelines pass
Example in GitLab:
test:
  script: run-tests.sh
  allow_failure: false
A broken pipeline should be treated as a stop-the-line event. Do not allow new work to proceed until the issue is resolved.
Use parallelism judiciously
Parallel jobs improve feedback time, but only when applied correctly. Split test suites, linting, or service builds into separate jobs. But monitor for resource contention or flaky behavior.
Example parallel matrix in GitHub Actions:
strategy:
  matrix:
    node-version: [18, 20, 22]
Avoid spawning unnecessary jobs. Monitor runner availability and enforce max concurrency if needed.
Keep pipelines fast and focused
Engineers respect pipelines that provide fast feedback. Long pipelines get ignored, skipped, or disabled. Aim to keep mainline builds under 10 minutes. Use layered pipelines if you need more depth.
Approach:
- Quick tests for each PR
- Full regression nightly or on merge to main
- Expensive tests (load, fuzz, UI) in scheduled or targeted pipelines
Use caching, dependency pruning, and optimized containers to reduce build time.
Deflake and isolate failures
Flaky tests erode trust in the pipeline. Identify and fix or quarantine them. Capture enough logs and artifacts to reproduce any failure.
Tools:
- Rerun failed tests only
- Archive screenshots for UI failures
- Store logs centrally
Example in Cypress:
CYPRESS_RECORD_KEY=${{ secrets.CYPRESS_RECORD_KEY }} cypress run --record --parallel
Treat any non-deterministic behavior as a defect, not as noise.
Use safe deployment practices
Promote artifacts through isolated environments. Mirror production closely in staging. Use deployment strategies that allow for validation before full rollout.
Options:
- Canary deployments
- Blue-green deployments
- Feature flags
Pipelines should handle promotion between environments and rollback where needed. Use approvals at the right points.
deploy-prod:
  when: manual
  needs: deploy-staging
Do not push unverified builds straight to users.
Version Everything
Every artifact, script, and config should be versioned. Use tags or semantic versioning to track builds. Store metadata like commit SHA, build number, and change reason.
Benefits:
- Enables rollback
- Supports traceability
- Simplifies compliance
Tagging example:
git tag -a v1.6.2 -m "Release 1.6.2"Avoid single-person knowledge
Document pipeline design and review changes as a team. Avoid situations where only one person understands how the system works.
Best practices:
- Store pipeline logic in the repo
- Review changes via pull requests
- Maintain internal docs and diagrams
Cross-training reduces risk and helps new engineers onboard faster.
Tune notifications/alerts
Alert fatigue leads to ignored alerts. Route pipeline notifications by severity and audience.
Recommendations:
- Post success/failure updates to a low-noise channel
- Use Zenduty only for production-impacting failures
- Group similar failures when possible
Zenduty supports alert throttling and enrichment, which can reduce noise while preserving signal.
Continuously improve
Treat the pipeline as living infrastructure. Hold retrospectives on failures. Profile build times. Try new tools or patterns. Set a cadence for reviewing pipeline metrics and making changes.
Consider:
- Replacing flaky steps
- Refactoring YAML
- Improving cache use
- Tuning runner configurations
Include pipeline maintenance as part of regular engineering work.
Conclusion
For platform teams and SREs, investing in pipeline tooling reduces firefighting and improves system resilience. Automated testing, controlled rollout strategies, and rollback workflows all reduce on-call burden. Failures do not get lost. They are detected, routed, and addressed. That is what separates a mature delivery system from a collection of scripts and cron jobs.
If your current deployment pipeline lacks observability or manual steps are still common, now is the time to improve it. Start by treating your pipeline configuration as code. Monitor it, alert on failures and push artifacts through isolated environments. Most importantly, make sure your failure response is automated and reliable.
This is where tools like Zenduty can elevate your pipeline’s operational readiness. Zenduty connects your CI system to your on-call process. It ensures that when a pipeline breaks, the right engineer is notified with the right context and the right urgency. It helps teams respond faster, learn from every failure, and evolve toward reliability.
Here's how it works when an alert comes in:
Zenduty offers a free 14-day trial with full access to on-call scheduling, incident routing, and ZenAI postmortem generation.
No credit card required. If your team is serious about making your pipeline production-grade, this is a practical next step.

Rohan Taneja
Writing words that make tech less confusing.
