
What is Log Formatting? Best Practices with Examples

Last updated
Logs play a critical role in monitoring your applications and systems in terms of health, system behavior, and problem diagnosis. However, logs can assuredly bring value only if they are structured and well-formatted.
Effective log formatting can help identify an issue to fix on time rather than having to sift through unorganized, hard-to-read logs. In this blog, we delve into 7 super-effective practices for production logging to help you maximize your log analysis capabilities.
Importance of Log Formatting
Log formatting defines the structure that each log entry will have; therefore, entailing what data to include, the order of presentation, and the separation elements used. Proper log file formatting makes them more readable, allowing fast troubleshooting during root cause analysis (RCA), especially in scalable systems.
It’s like navigating through a dense forest without a map, unstructured logs are like wandering aimlessly, while structured logs serve as a guide to quickly find the information you need.
Benefits of Log Formatting
Log formatting offers undeniable benefits for companies that are able to track and read each activity happening within their IT infrastructure. Now let's dive deep into reasons how your formatted logs will benefit you:
- Speedy Troubleshooting: Well-formatted, organized logs allow you to scan through them proactively to identify problems and resolve them before it affects productivity or user experience.
- Quick Problem Detection: Log formatting makes it easier to detect crucial issues during postmortems compared to unstructured ones. This can prevent cascading failures, safeguarding mission-critical systems and customer-centric experiences.
- Highly Scalable: Structured logs are easier to manage as your application grows and they can be ingested without modification by middleware systems like Kafka or MQTT. These systems are essential in distributed environments where logs need to be processed in real-time across various microservices or IoT devices.
- Compliance: Most regulatory bodies require log data to be kept for certain intervals of time. Having well-formatted logs help you easily provide records during audits without utilizing additional time and effort.
- 360-Degree Application Health: Properly formatted logs offer comprehensive insights into general health and performance of an application. In IoT ecosystems, structured logs are essential for data-driven machine learning (ML) or deep learning (DL) models that capture device behavior and predict future issues with precision. For instance, logs from industrial IoT devices or smart home systems can be fed into ML models to optimize performance, predict failures, and enhance system intelligence.
Different Log Formats
Now that we’ve explored the benefits, let’s take a closer look at the types of log formats you may encounter and how they affect log analysis.
Logs generally fall into 3 main categories, each offering different levels of organization and benefits. Let’s discuss each type before we dive into the best practices to improve log formatting.
Unstructured Logs
Unstructured logs don’t follow any set format as they free-flow during development, making them easier to generate.
However, as your application grows, these logs can become a headache to manage and analyze. You can use command-line tools like sed, awk, or grep to filter through the logs but it would be a time-consuming task, utilizing your valuable resources.
2023-09-20 10:15:45 Error: Connection failed for user JohnDoe. Server timeout.
2023-09-20 10:16:03 User JohnDoe attempted login. Success.
10:16:30 - System crashed! Restart initiated.
10:17:02 Memory usage critical at 95%. Free up resources.
2023-09-20 10:17:15 Issue with database query - slow response
Semi-structured Logs
Semi-structured logs bring a little more order to the chaos. They do follow some patterns but they still retain the narrative style from the unstructured format. As seen below, you’ll notice that details like timestamps, log levels, and process IDs are consistent but the message itself varies and isn’t consistent to be read or filtered by a machine.
It’s like having a somewhat organized closet – things are in the right general area, but you might still need to search for what you need.
Timestamp: 2023-09-20 10:15:45 | Level: ERROR | Event: ConnectionFailed | User: JohnDoe | Message: Server timeout.
Timestamp: 2023-09-20 10:16:03 | Level: INFO | Event: LoginSuccess | User: JohnDoe | Message: User logged in successfully.
Timestamp: 2023-09-20 10:16:30 | Level: CRITICAL | Event: SystemCrash | Message: System crashed. Restart initiated.
Timestamp: 2023-09-20 10:17:02 | Level: WARNING | Event: MemoryHigh | Usage: 95% | Message: Memory usage critical. Free up resources.
Timestamp: 2023-09-20 10:17:15 | Level: ERROR | Event: DatabaseSlowResponse | Message: Issue with database query, slow response.
Structured Logs (JSON)
If your organization is rooting for efficiency, reliability, and clarity, structured logs are your best bet. They follow a consistent pattern to format logs where every entry looks the same, making it easier for automated tools to analyze log data.
JSON is the most popular format for structuring as it offers a clean way to capture important details in specific fields. While structured logs are harder for people to read, especially during development, you can configure your setup to resolve this matter.
{
  "timestamp": "2023-09-20 10:15:45",
  "level": "ERROR",
  "event": "ConnectionFailed",
  "user": "JohnDoe",
  "message": "Server timeout."
},
{
  "timestamp": "2023-09-20 10:16:03",
  "level": "INFO",
  "event": "LoginSuccess",
  "user": "JohnDoe",
  "message": "User logged in successfully."
},
{
  "timestamp": "2023-09-20 10:16:30",
  "level": "CRITICAL",
  "event": "SystemCrash",
  "message": "System crashed. Restart initiated."
},
{
  "timestamp": "2023-09-20 10:17:02",
  "level": "WARNING",
  "event": "MemoryHigh",
  "usage": 95,
  "message": "Memory usage critical. Free up resources."
},
{
  "timestamp": "2023-09-20 10:17:15",
  "level": "ERROR",
  "event": "DatabaseSlowResponse",
  "message": "Issue with database query, slow response."
}
Simply set up your framework to have a semi-structured and colorized format during development and structured JSON output during production.
JSON vs Parquet for Log Storage and Analysis
While JSON makes for an excellent choice for real-time logging but when it comes to working with large-scale data storage and analysis, Parquet is your best choice.
Let’s discuss how JSON and Parquet differ and when to use them for maximum efficiency:
- When to use JSON: JSON is schema-less and text-based, making it ideal for systems where logs need to be human-readable. It also integrates seamlessly with systems like Elasticsearch, Kafka, and Fluentd for real-time ingestion and querying to help with real-time log monitoring and troubleshooting in production environments. Although JSON is pretty flexible, it has some limitations when scaling. Due to the verbose nature of JSON, it leads to high storage consumption and can be slow since it requires scanning the entire file, which is inefficient for large-scale log datasets.
- When to use Parquet: When it comes to working with big data frameworks like Apache Hadoop and Spark, Parquet’s columnar storage will help you with selective querying and efficient compression. This format drastically reduces I/O by only reading relevant columns during queries, reducing time while going through log data. Parquet is suitable for batch processing, data warehousing, and long-term storage.
Best Practices for Log Formatting
Now that we have understood types of formatting, let’s discuss some of the industry best practices with log file examples for maintaining clarity and efficiency.
1. Use Structured JSON Logging
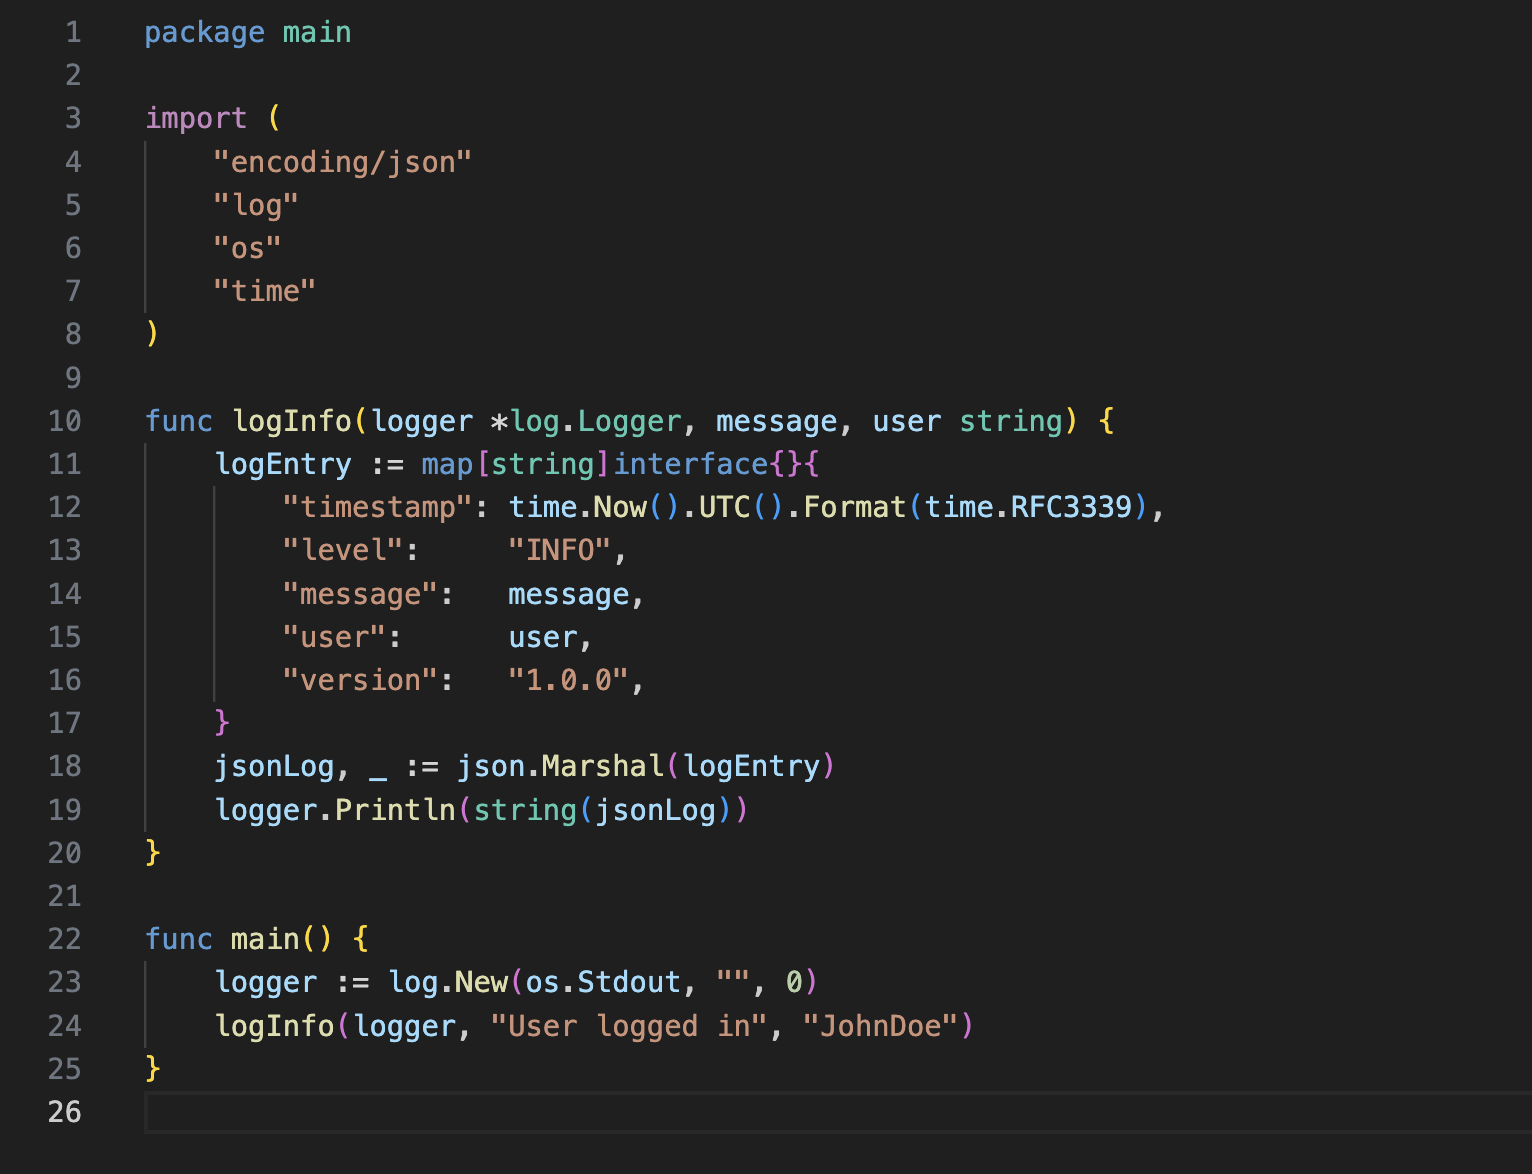
If you wish to make your logs more organized and easier to read, structuring it using JSON logging is the way to go. This ensures your logs remain robust, secure, and agile in handling real-time traffic. For instance, production logging with structured logs makes logs cleaner and easier to analyze. Here’s an example of how to set up JSON logging in Go:
package main

import (
    "encoding/json"
    "log"
    "os"
    "time"
)

func logInfo(logger *log.Logger, message, user string) {
    logEntry := map[string]interface{}{
        "timestamp": time.Now().UTC().Format(time.RFC3339),
        "level":     "INFO",
        "message":   message,
        "user":      user,
        "version":   "1.0.0",
    }
    jsonLog, _ := json.Marshal(logEntry)
    logger.Println(string(jsonLog))
}

func main() {
    logger := log.New(os.Stdout, "", 0)
    logInfo(logger, "User logged in", "JohnDoe")
}
And here’s how the log will look:
{
  "timestamp": "2024-09-20T08:21:54Z",
  "level": "INFO",
  "message": "User logged in",
  "user": "JohnDoe",
  "version": "1.0.0"
}
You can even configure your app dependencies to create structured logs, For example, both PostgreSQL and Nginx can log in JSON format. Here's an example of how you can adjust your Nginx configuration:
http {
  log_format my_json_logs escape=json
  '{'
    '"log_time":"$time_iso8601",'
    '"process_id":"$pid",'
    '"client_ip":"$remote_addr",'
    '"auth_user":"$remote_user",'
    '"http_request":"$request",'
    '"response_status":"$status",'
    '"bytes_sent":"$body_bytes_sent",'
    '"request_duration_ms":"$request_time",'
    '"referrer":"$http_referer",'
    '"user_agent":"$http_user_agent"'
  '}';

  access_log /var/log/nginx/my_custom_logs.json my_json_logs;
}
Instead of the old, hard-to-read log formats like this:
127.0.0.1 sam Sam [09/Sep/2024:09:21:53 +0530] "GET / HTTP/1.1" 431 436 "-" "Chrome/7.0 (Windows NT 11.0; Win64; x64) AppleWebKit/537.36 (KHTML, like Gecko) Chrome/90.0.4531.93 Safari/432.65"You’ll now have clean, readable logs:
{
  "log_time": "2023-09-06T15:13:11+00:00",
  "process_id": "8",
  "client_ip": "217.138.222.109",
  "auth_user": "",
  "http_request": "GET /icons/ubuntu-logo.png HTTP/1.1",
  "response_status": "404",
  "bytes_sent": "197",
  "request_duration_ms": "0.000",
  "referrer": "http://192.168.100.1/",
  "user_agent": "Mozilla/5.0 (Windows NT 10.0; Win64; x64) AppleWebKit/537.36 (KHTML, like Gecko) Chrome/98.0.4758.87 Safari/537.36"
}
2. Standardize on String-Based Log Levels
In a large distributed system with microservices, unstructured logs make it extremely difficult to trace errors across services. By using structured logs with consistent log levels, engineers can easily track and debug issues across different systems.
Many frameworks use numbers behind the scenes to represent these levels. For example:
{
  "debug": -6,
  "info": 2,
  "warn": 5,
  "error": 8
}
But let’s face it, numbers aren’t exactly intuitive. That’s why most logs display them as strings to make things clearer:
{
  "level": "INFO",
  "time": "2023-09-17T13:00:00Z",
  "msg": "Application started"
}
On the other hand, some frameworks, like Node.js’s Pino, stick with numbers:
{
  "level": 30,
  "time": 1643664517737,
  "msg": "Application started"
}
To keep things consistent across your system and avoid confusion, it’s a good idea to use string-based log levels. It makes logs easier to read and understand at a glance.
3. Record Timestamps in ISO-8601 Format
Clarity is everything when you’re dealing with timestamps. To make sure your dates are precise and easy to read, use the ISO-8601 format (or the similar RFC 3339). Here is an example of how it would look like:
{
  "timestamp": "2023-09-17T13:00:00.123Z",
  "level": "INFO",
  "msg": "Request received"
}
Make sure your time stamps are in UTC by default so you’re not juggling time zones when comparing logs from different systems and locations.
4. Include Log Source Information
Have you ever tried to figure out where exactly in the code a log came from? It’s a bit of a time-consuming task and that’s why it is crucial to include source information in your logs. Most frameworks allow you to automatically add the function name, file, and line number where the log was generated. Here’s an example
{
  "time": "2023-09-17T13:00:00Z",
  "level": "DEBUG",
  "source": {
    "function": "main.main",
    "file": "main.go",
    "line": 42
  },
  "msg": "Debugging an issue"
}
In more complex environments, like distributed systems, adding identifiers such as hostname or container ID can also help pinpoint where the issue occurred.
{
  "time": "2023-09-17T13:00:00Z",
  "level": "DEBUG",
  "source": {
    "function": "main.main",
    "file": "main.go",
    "line": 42,
    "hostname": "server01",
    "container_id": "abc123"
  },
  "msg": "Debugging an issue"
}
5. Include Build Version or Commit Hash
It becomes highly important to know which version of your application generated specific logs as your code evolves. If you include the build version and commit hash in your logs, it will help you link them to a specific point in time. This way, you can track down the exact state of your application when the log was created even if the code has changed.
For example:
{
  "time": "2023-09-17T13:00:00Z",
  "level": "INFO",
  "msg": "Application started",
  "build": {
    "version": "1.0.0",
    "commit_hash": "a1b2c3d4"
  }
}
6. Include Stack Traces in Your Error Logs
A stack trace in your logs can be a great way to identify the problem when an error pops up in your system. Most frameworks capture these details automatically whenever something breaks, while some might need a little bit of tweaking to ensure consistency.
For example, here’s how a stack trace looks when using Python’s python-json-logger:
{
  "name": "__main__",
  "timestamp": "2023-09-17T13:00:00Z",
  "severity": "ERROR",
  "message": "division by zero",
  "exc_info": "Traceback (most recent call last):\n  File \"example.py\", line 10, in <module>\n    1 / 0\nZeroDivisionError: division by zero"
}
In the snippet above, the entire stack is thrown into a string field but it’s not that easy to parse. Some frameworks, like Structlog, go a step further and break down the stack trace into structured JSON, like this:
{
  "event": "Cannot divide one by zero!",
  "level": "error",
  "timestamp": "2023-09-17T13:00:00Z",
  "exception": {
    "type": "ZeroDivisionError",
    "value": "division by zero",
    "frames": [
      {
        "filename": "example.py",
        "lineno": 10,
        "function": "<module>",
        "code": "1 / 0"
      }
    ]
  }
}
Structured stack traces in JSON make it even easier for log analyzer tools to parse and analyze errors.
7. Be Selective with What You Log
Logging too much can cause your logs to clutter and may even expose sensitive information. You can control which fields are logged by implementing a method like toString() or String() in your objects to decide which parts are safe to log.
Here’s an example using Go’s slog package:
type User struct {
    ID    string `json:"id"`
    Name  string `json:"name"`
    Email string `json:"email"`
    Password string `json:"password"`
}

func (u *User) LogValue() slog.Value {
    return slog.StringValue(u.ID)
}

Output:

{
  "time": "2023-09-17T13:00:00Z",
  "level": "INFO",
  "msg": "User logged in",
  "user_id": "42"
}
In this log file example, only the ID field is logged, keeping sensitive data like passwords out of the logs. This ensures your logs remain secure while containing only the information you need.
Final Thoughts
Well-structured logs are your silent sentinels in keeping your systems incident-ready and in control. Implementing these practices would empower your teams to be agile, adaptive, and resilient in handling potential issues before they cause any major trouble in your systems. With structured logs, it becomes a breeze to maintain a scalable system that’s fast, secure, and ready for any challenge.
Key Takeaways
- Well-structured logs significantly enhance your ability to troubleshoot and maintain systems efficiently.
- Choosing the right log format, whether JSON for real-time monitoring or Parquet for large-scale data analysis, is crucial to optimizing both performance and scalability.
- Log standards must ensure compatibility with middleware systems like Kafka and MQTT, ensuring your logs are easily ingested and processed in distributed environments.
- Implementing best practices, such as using ISO-8601 timestamps, structured log levels, and stack traces, makes logs easier to analyze and boosts productivity across development and operations teams.
- Logs from IoT devices can be leveraged for advanced machine learning and deep learning applications, capturing device behavior and improving predictive maintenance.
- Proper log management is essential for maintaining compliance with regulatory requirements while improving the overall health and performance of your applications.

Rohan Taneja
Writing words that make tech less confusing.
