
Log Levels Explained and How to Use Them
Last updated
Logs are the first place we look when something breaks but not all logs are equal. Some are noisy and some can tell you exactly when and why the system crashed. That distinction comes from log levels.
What are log levels?
A log level is a tag that marks how important or urgent a log message is. It helps filter the firehose of log data by letting you focus only on what's relevant during incident response. When used right, log levels separate the everyday from the critical. When used wrong, they either hide real problems or overwhelm your team with alert noise.
For production engineers and SREs, consistent log levels are not just a logging hygiene issue. They directly impact how fast you detect incidents, how well you route alerts, and how efficiently your team can debug and triage under pressure. The logs that wake you up at 2 AM should always be meaningful and that starts with setting the right severity.
Most frameworks, from Python to Java to Node.js, support standard levels like DEBUG, INFO, WARN, ERROR, and FATAL. These are not arbitrary. They are part of an established hierarchy rooted in Unix syslog standards. Even structured log platforms like Serilog, Zap, or Loguru follow the same patterns, with some customizations.

Here’s what a basic example looks like using Python’s built-in logging module:
import logging

logging.basicConfig(level=logging.INFO)
logger = logging.getLogger("web-server")

logger.info("Server started on port 8080")
logger.warning("Memory usage at 85%")
logger.error("Database connection failed")
Each of these logs carries an intent. INFO is routine, WARNING suggests you need to look into it soon, ERROR means something failed and needs fixing and If you mix these up or use them inconsistently, your observability stack becomes unreliable.
In this guide, we will break down each level, when to use them, what to avoid, and how to wire your log levels directly into your alerting, routing, and post-incident workflows using tools.
Log level hierarchy explained
Every logging framework follows a severity hierarchy. At the top is FATAL, and at the bottom is TRACE. The higher you go, the more urgent the message. The lower you go, the more verbose and diagnostic the output. This order is what allows log filtering to work correctly. When your logger is set to WARN, it will suppress INFO and DEBUG, but still capture ERROR and FATAL.
Here is the standard log level hierarchy from highest to lowest:
- FATAL
- ERROR
- WARN
- INFO
- DEBUG
- TRACE
Some systems like syslog include levels such as CRITICAL, ALERT, or EMERGENCY. Others add custom levels like NOTICE or AUDIT. But for most use cases, the six levels above are enough.
Severity Filtering in Action
Let’s take a Java example using Log4j2. You can configure the logger to capture only ERROR and above like this:
<Logger name="com.myapp" level="error" additivity="false">
    <AppenderRef ref="Console"/>
</Logger>
This config ensures that INFO and DEBUG logs will not clutter production logs. Only real failures will be visible. This is essential for noise reduction.
Similarly, in a Node.js application using Winston:
const winston = require('winston');

const logger = winston.createLogger({
  level: 'warn',
  transports: [
    new winston.transports.Console()
  ]
});

logger.info("This won't be logged");
logger.error("This will");
If your log level defaults are not consistent across services, you lose the benefit of structured logging. A WARN in one service should mean the same thing in another. This consistency is critical for centralized log platforms like ELK, Loki, or Datadog.
In the next section, we’ll break down each log level individually, starting with FATAL, and show when and how to use them correctly.
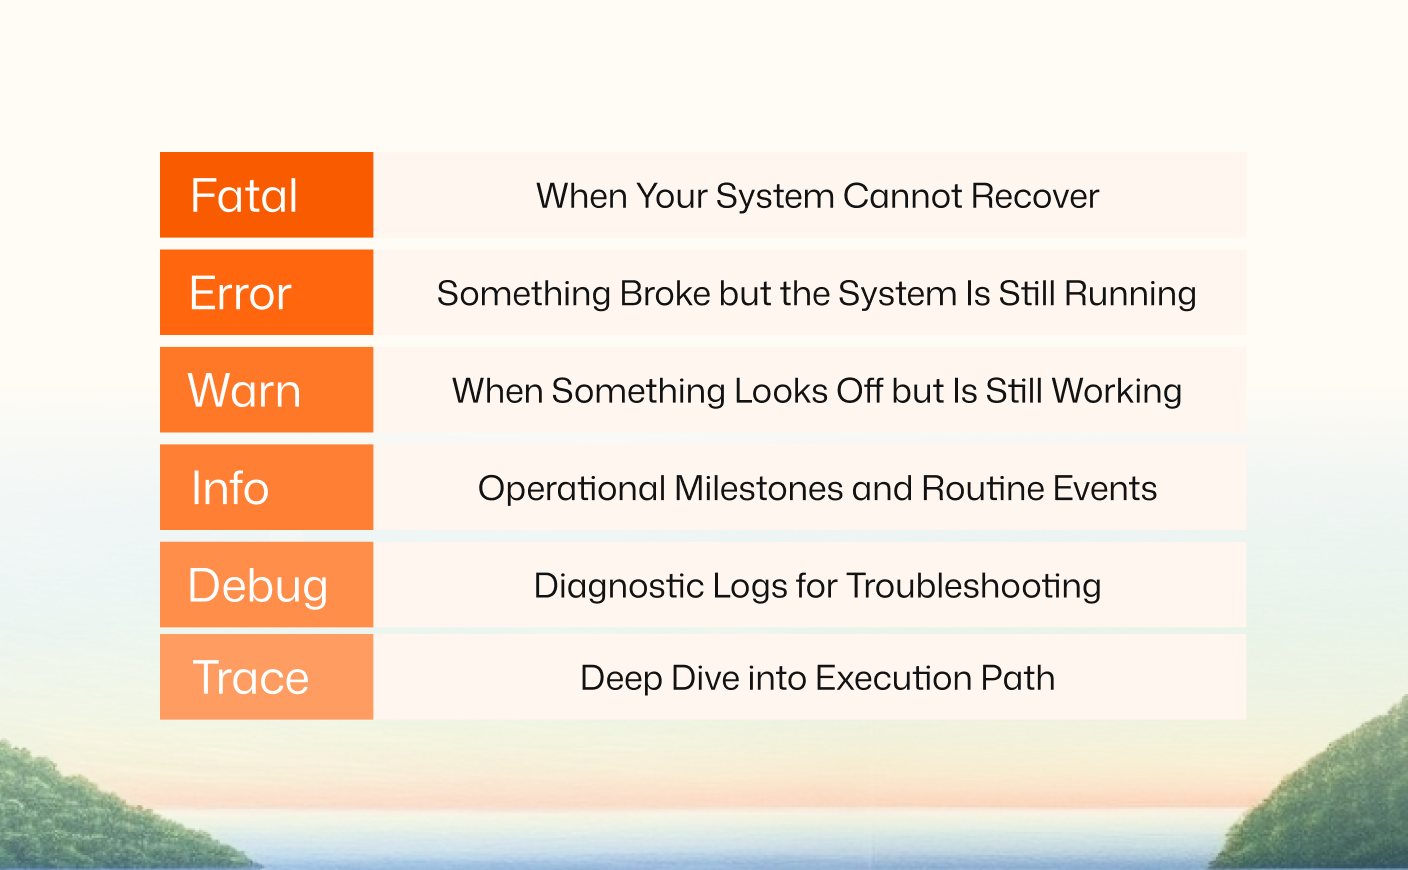
FATAL: When Your System Cannot Recover
FATAL is the top of the log level hierarchy. It means the application has hit a state it cannot recover from. These logs are written when the system must shut down or stop functioning to prevent further damage.
A FATAL log indicates a hard failure. There is no fallback, no retry, and no degraded mode. It is a clear signal that something broke beyond recovery. These are the logs you want to page someone for, immediately.
When to Use FATAL
Examples include:
- Database is unreachable on startup
- Configuration is invalid and cannot be parsed
- Memory is exhausted and the process cannot continue
- A required dependency failed to initialize
You should not log something as FATAL unless you are about to crash or exit the process. Misusing this level will lead to alert fatigue.
Example in Go Using Uber's Zap
if err := db.Connect(); err != nil {
    logger.Fatal("Failed to connect to DB. Exiting.", zap.Error(err))
    os.Exit(1)
}
This exits immediately after logging. That is expected for FATAL. You log and then stop. Most logging frameworks will automatically flush logs before the process exits.
Tip
If you are sending logs to a tool like Datadog or Loki and integrating with Zenduty, make sure any FATAL log triggers an alert with high urgency. In Zenduty, you can map incoming logs with level=FATAL to a critical Alert Type and route it to the 24x7 on-call rotation.
ERROR: Something Broke but the System Is Still Running
ERROR level logs indicate a failure that affected functionality but did not crash the system. These logs tell you that something went wrong and needs attention, but the application is still alive and possibly running in a degraded state.
When to Use ERROR
Use this level when an operation fails in a way that impacts users or critical workflows but does not bring down the entire service. This includes:
- An API request fails due to an unhandled exception
- A database write fails after retry attempts
- A background job throws an error and cannot complete
- A downstream service is unavailable and no fallback exists
Avoid logging recoverable or expected exceptions as ERROR. If the failure is handled gracefully and the user experience is unaffected, log it at WARN or lower. Overusing ERROR pollutes the logs and makes real issues harder to find.
Example in Python Using Standard Logging
try:
    payment.process()
except PaymentGatewayException as e:
    logger.error("Payment failed: %s", str(e))
This captures an application-level failure that should be tracked and fixed. Include context and identifiers in the message to make it easy to debug later.
Tip
In Zenduty, configure alert rules to trigger incidents for specific ERROR logs. You might not alert on every error, but logs with messages like "Payment failed" or "External API unavailable" can be mapped to auto-create incidents. You can also set rate limits, such as alert only if the same error occurs more than five times in ten minutes, to avoid noise.
WARN: When Something Looks Off but Is Still Working
WARN level logs are for situations that are unusual or could lead to errors if ignored, but the system is still functioning normally. These logs help you catch potential issues before they escalate into actual failures.
When to Use WARN
Use this level when the application experiences a condition that deviates from the norm but is still within acceptable bounds. Typical examples include:
- Resource usage approaching critical thresholds
- Retryable errors that were successfully handled
- Use of deprecated APIs or configuration options
- A fallback path was used instead of the primary logic
The goal with warnings is to highlight technical debt, environmental drift, or non-critical reliability risks that should be investigated but do not need immediate intervention.
Example in Go Using Uber's Zap Logger
if usage > 85 {
    logger.Warn("High memory usage",
        zap.Float64("percent", usage),
        zap.Float64("threshold", 85))
}
This captures a soft limit breach that could become a serious issue if ignored. It is not actionable at 2 AM but worth reviewing during work hours.
Tip
Route WARN level logs to lower urgency escalation policies in Zenduty. You can use alert rules to auto-tag these incidents as non-critical and notify teams via Slack or email instead of paging. This reduces noise while still tracking potential issues.
INFO: Operational Milestones and Routine Events
INFO level logs document the normal, expected operation of your system. These messages confirm that components are working as intended and serve as markers for system events that are useful during retrospectives, audits, or general observability.
When to Use INFO
Use INFO logs to capture significant but non-critical events such as:
- Service startup and shutdown
- Successful configuration loads
- User logins or sign-ups
- Completion of batch jobs
- External service health checks passing
INFO logs give you a high-level timeline of system activity. In production, this level is often the default logging threshold, meaning everything from INFO and above gets logged while ignoring more verbose levels like DEBUG or TRACE.
Example in Python
import logging

logger = logging.getLogger("order-service")
logger.setLevel(logging.INFO)

logger.info("User login successful", extra={"user_id": 1234, "ip": "10.2.3.4"})
This log confirms a successful user action and includes metadata that can be useful for correlation in observability tools.
Best Practices
Do not overload INFO logs with excessive detail. Avoid dumping full request payloads or verbose system state. The log should be readable, concise, and informative. Also, avoid logging personally identifiable information (PII) at this level.
Tip
INFO logs typically do not trigger alerts. However, they are valuable in Zenduty for building context around an incident. When investigating a failure, looking at the surrounding INFO events often clarifies what happened before the issue occurred.
DEBUG: Diagnostic Logs for Troubleshooting
DEBUG level logs provide detailed information intended primarily for developers and engineers debugging an application. These logs capture internal states, configuration values, API responses, and other granular data not required during routine operations.
When to Use DEBUG
Use DEBUG logs when you need to:
- Trace the flow of execution
- Log computed variables or internal state
- Capture request or response payloads
- Understand retry logic outcomes or decision paths
- Instrument temporary diagnostics for issues hard to reproduce
These logs are helpful during development and when investigating hard-to-pinpoint production bugs. However, in most production environments, DEBUG logs are disabled to reduce storage usage and avoid performance overhead.
Example in Go using Uber’s Zap logger
logger.Debug("User lookup result",
    zap.String("userID", userID),
    zap.Any("profile", profileData),
)
This output is valuable during development or active incident triage but should not remain on by default in production.
Considerations for Production
- Use dynamic log level controls where possible. Toggle DEBUG logs at runtime via environment variable or remote control.
- Sanitize sensitive data. Debug logs can unintentionally expose API keys, tokens, or user PII.
- Limit scope. Only enable DEBUG logs on specific components or under defined conditions to avoid log noise.
Zenduty Use Case
While Zenduty does not typically trigger alerts on DEBUG logs, these logs can be included in alert payloads for deeper context. For example, if an ERROR triggers an incident, attaching relevant DEBUG traces can speed up resolution during triage.
TRACE: Deep Dive into Execution Path
TRACE is the most verbose log level available. It captures every detail of an application's execution, including entry and exit points for functions, intermediate values, conditional branches, loop iterations, and control flow changes. TRACE logs are useful when debugging extremely complex logic where DEBUG is not granular enough.
When to Use TRACE
Use TRACE when:
- Investigating issues with deeply nested logic or recursive functions
- Understanding the exact call sequence leading to a failure
- Profiling code paths in a non-production environment
- Verifying the correctness of logic under edge-case conditions
This level is reserved for local development or test environments only. It is not suitable for production due to the sheer volume of data and its impact on storage and performance.
Example in Java using Log4j2
logger.trace("Entering validateOrder(orderId={})", orderId);
// Logic to validate order
logger.trace("Exiting validateOrder, result={}", result);
This allows developers to reconstruct the entire code path, especially when reviewing logs after complex test scenarios.
Guidelines for Using TRACE
- Enable only for targeted components and short durations
- Use sampling or conditional logging to reduce noise
- Avoid writing trace logs to persistent storage unless needed
- Be aware of the performance cost in high-throughput services
Zenduty Use Case
TRACE logs are not directly useful for triggering alerts in Zenduty, but they can be bundled into an incident context to help engineers debug faster. For example, if a FATAL log initiates an incident, including TRACE output in the payload or linked log artifact gives responders a full view of execution prior to failure.
Logging Level Configuration Strategies
Choosing what log levels to use in each environment is not just about verbosity. It is about getting actionable signal without wasting disk, compute, or human attention. A well-thought-out logging configuration helps balance observability with cost and operational clarity.
Environment-Based Logging Level Defaults
Each environment should have a baseline logging level that aligns with its purpose.
- Local/Dev: Set to DEBUG or TRACE. Enable full verbosity to validate logic and catch edge-case behavior.
- Staging/Preprod: Set to INFO or DEBUG. This mirrors production behavior while still surfacing rich debug data.
- Production: Default to INFO or WARN. Avoid debug or trace logging in production unless toggled dynamically.
Here’s how you can configure the default log level in a Python application:
import logging

logging.basicConfig(level=logging.INFO)  # Adjust to DEBUG or WARNING as needed
logger = logging.getLogger("payment_service")
You can also dynamically change levels at runtime for a single module:
logger.setLevel(logging.DEBUG)
This is useful for ad-hoc debugging during incident response.
Component-Specific Overrides
In microservice or modular applications, not every component needs the same level of verbosity. Some services may be more critical or more stable than others. Use targeted overrides.
For example, in a logback.xml config for a Java service:
<logger name="com.myapp.database" level="DEBUG" />
<logger name="com.myapp.api" level="WARN" />
This config enables debug logs for the database module but suppresses verbose output for the API layer unless there is a warning or error.
Dynamic Log Level Management
Modern logging frameworks support dynamic level control using environment variables, runtime toggles, or API endpoints. This is critical in production where you may need to increase verbosity for a specific service or timeframe.
For example, with Log4j2, you can modify log levels via JMX without restarting the application:
jconsole # Connect and change logger levels via MBeansOr in Kubernetes, update a config map that your service watches for log level updates.
The logging level strategy should evolve with system maturity. Early in the lifecycle, you want more logs to debug. As the system stabilizes, shift focus to high-value logs. Automate and document your logging policies so teams know what to expect in each environment.
Driving Post-Incident Analysis with Log Levels and Zenduty
After an incident is resolved, the logs become your timeline. If your log levels are structured well, they help reconstruct the sequence of events with minimal guesswork. This is where log levels play a critical role in postmortems and retrospective reviews.
Using Log Levels to Reconstruct Incident Timelines
During an outage, logs at different levels can be stitched into a narrative.
- INFO shows routine system behavior before and after the incident
- WARN highlights degraded conditions or thresholds being approached
- ERROR logs identify where failures occurred
- FATAL entries pinpoint the system break
By aligning logs by level and timestamp, you can map the degradation curve clearly. For example, a WARN about memory at 85% may be logged five minutes before a FATAL crash due to OutOfMemoryError.
Tools like Grafana Loki, Datadog, and Kibana allow filtering by level and timestamp:
{app="checkout", level="ERROR"} | line_format "{{.timestamp}} - {{.msg}}"This gives your team a filtered, time-aligned sequence of critical events.
Writing Postmortems with Zenduty’s ZenAI
Zenduty provides an automated incident analysis engine called ZenAI. Once an incident is resolved, ZenAI can generate a draft postmortem based on log events, timeline annotations, and incident metadata.
This helps teams:
- Reduce manual documentation time
- Maintain consistency in incident reviews
- Identify patterns across incidents over time
A typical ZenAI postmortem includes:
incident_summary:
  title: "Database connection pool exhausted"
  severity: "High"
  root_cause: "Application did not release connections during high load"
  contributing_factors:
    - connection leak in retry block
    - spike in concurrent user sessions
  timeline:
    - 02:31: WARN: Connection pool usage at 90%
    - 02:33: ERROR: Cannot acquire DB connection
    - 02:34: FATAL: Service timeout after retry exhaustion
  resolution:
    - Restarted service
    - Deployed patch to close connections properly
ZenAI uses log levels to highlight the key turning points. This gives engineers clarity and lets them focus on long-term fixes rather than recollecting details under pressure.
We hope this blog helps you make better sense of how to use log levels in a way that’s practical and reliable for your team. If you want to put some of this into action with better alert routing, smarter on-call, and automated postmortems, give Zenduty a spin.
You can try it free for 14 days. No credit card required. Just a better way to manage incidents, right out of the box.
14-DAY FREE TRIAL || NO CC REQUIRED
Frequently Asked Questions

Rohan Taneja
Writing words that make tech less confusing.
