
OpenTelemetry Collector: The Complete Guide for DevOps Engineers
Last updated
Modern systems throw off data from everywhere. Logs, metrics, traces, and events are scattered across agents, exporters, and monitoring tools. In fact, a lot of engineers today waste time wiring services to backends, duplicating configs, and paying for data they cannot even use.
That's where OpenTelemetry Collector comes in to fix this. It is a single, vendor-neutral pipeline that receives telemetry, processes it, and sends it wherever you need.
In this guide you'll learn:
- Architecture
- Core components
- Instrumentation vs. Collector
- Installation and setup
- Configuration examples
- Performance and scaling
- Security best practices
- Monitoring and troubleshooting
- Real-world use cases
- FAQ
By the end, you will surely be able to guide someone on what the Collector is, why it matters, how to set it up, and how teams use it in production. Let's jump right in!
What is the OpenTelemetry Collector? (Architecture Deep Dive)
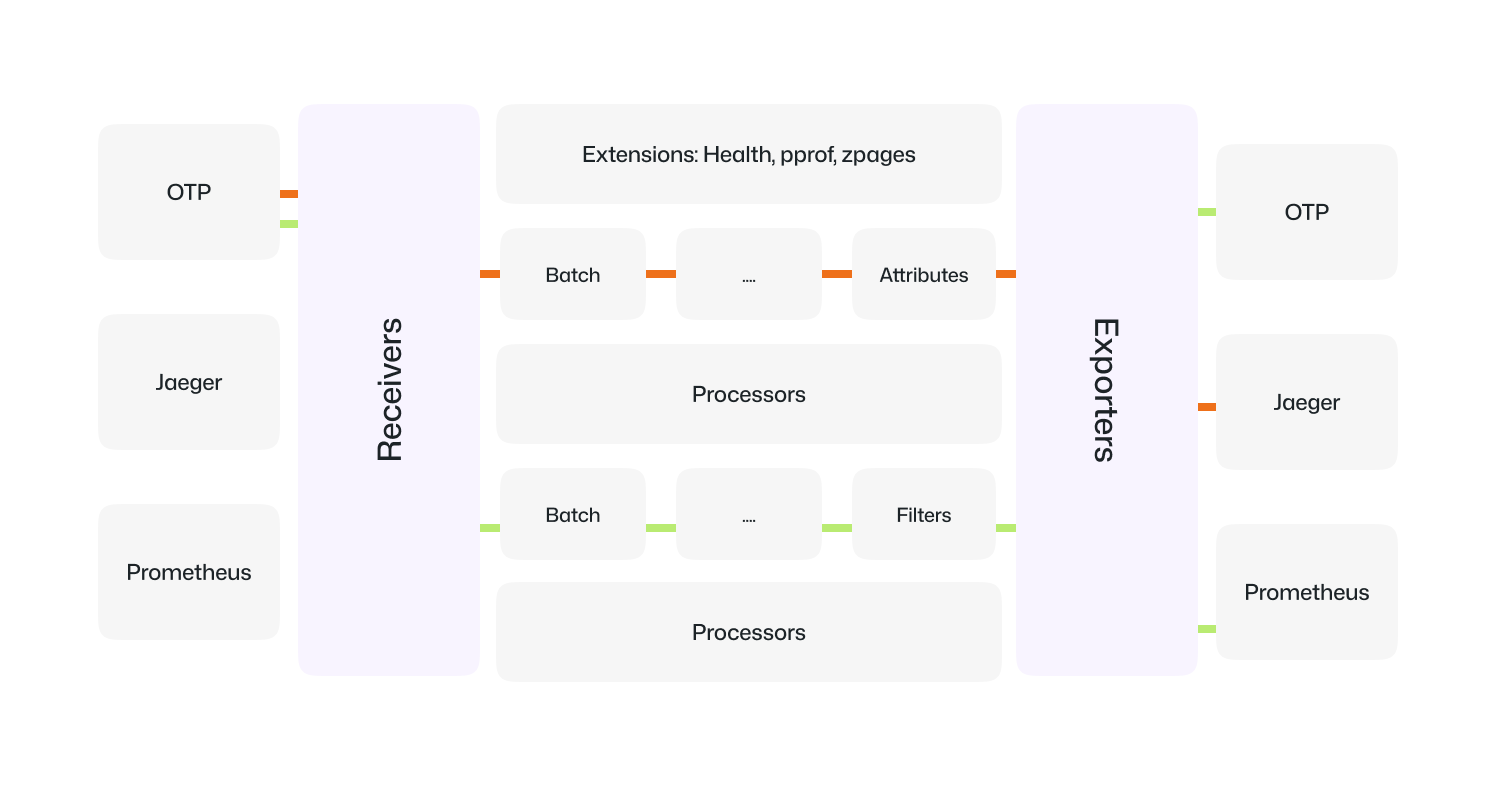
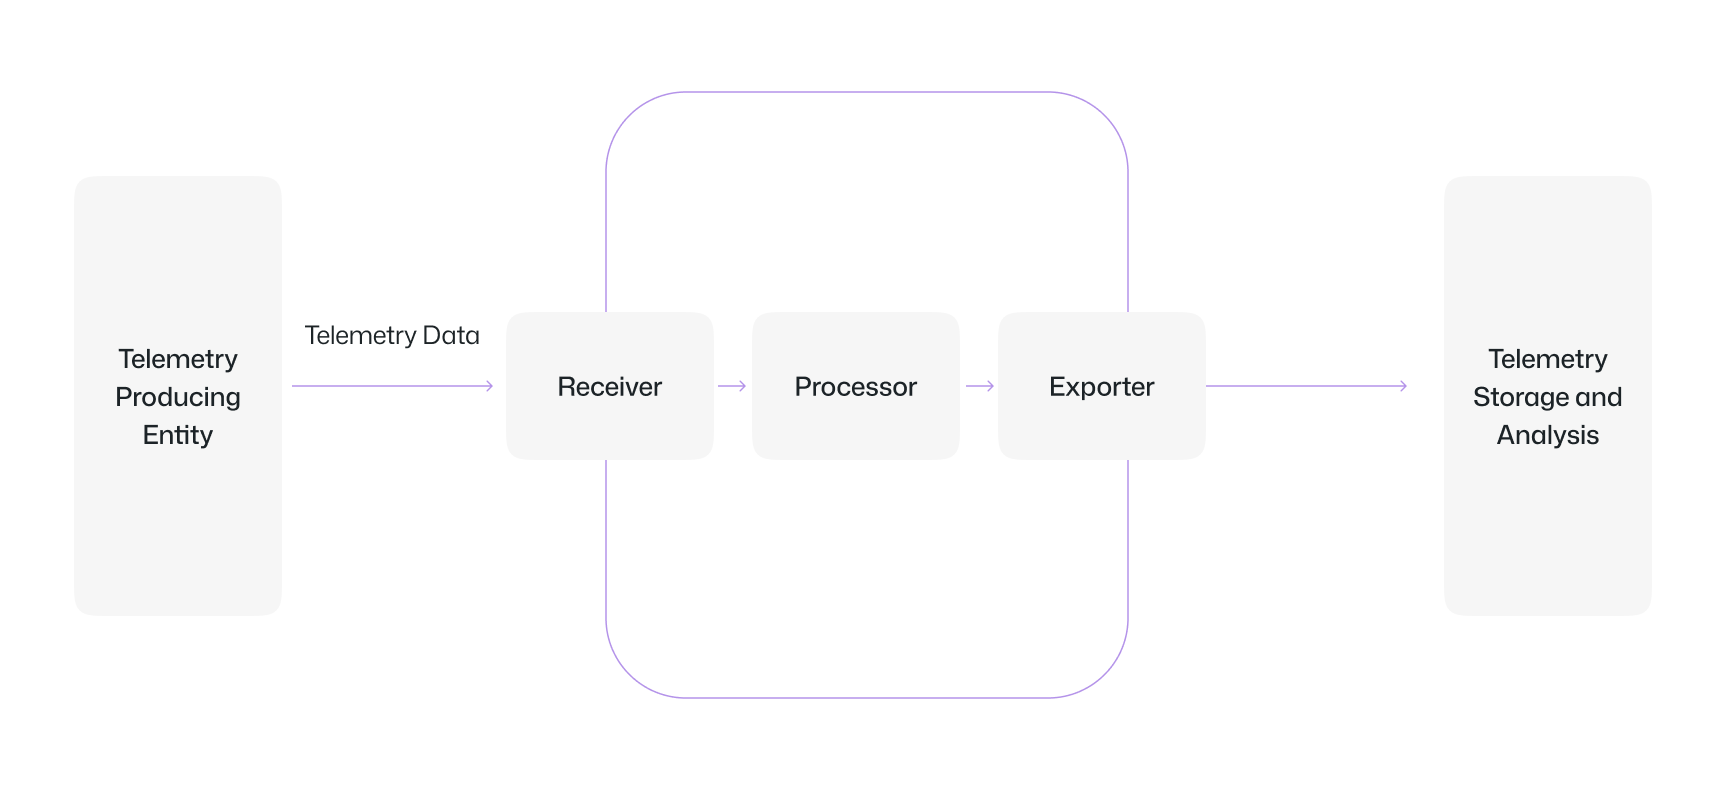
The OpenTelemetry Collector (Otel Collector) is an open-source service that serves as a data pipeline which receives, processes and export the telemetary data from sources to backends and has modular architecture with three components. these are 'Receivers', 'Processors' and 'Exporters'.
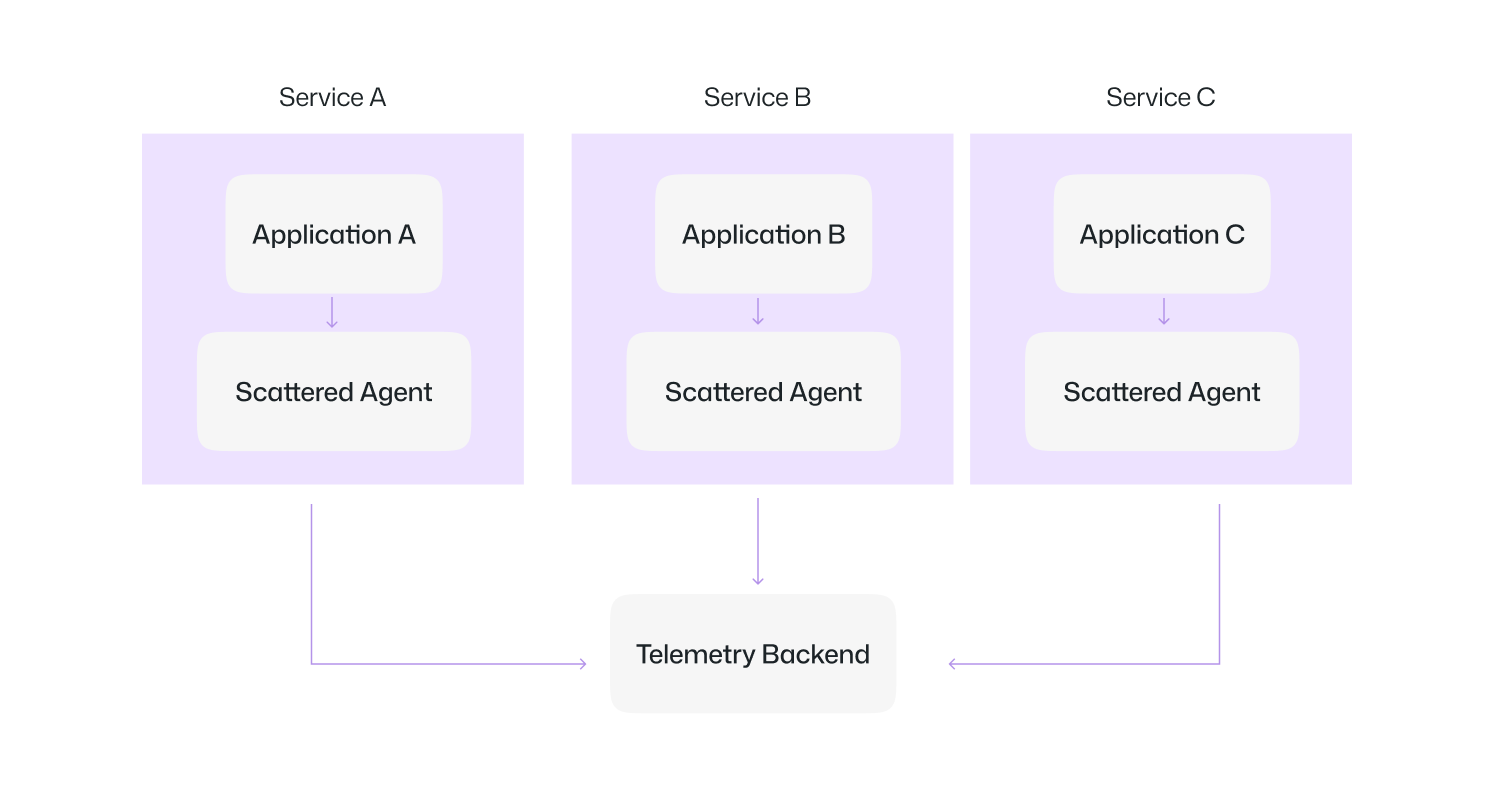
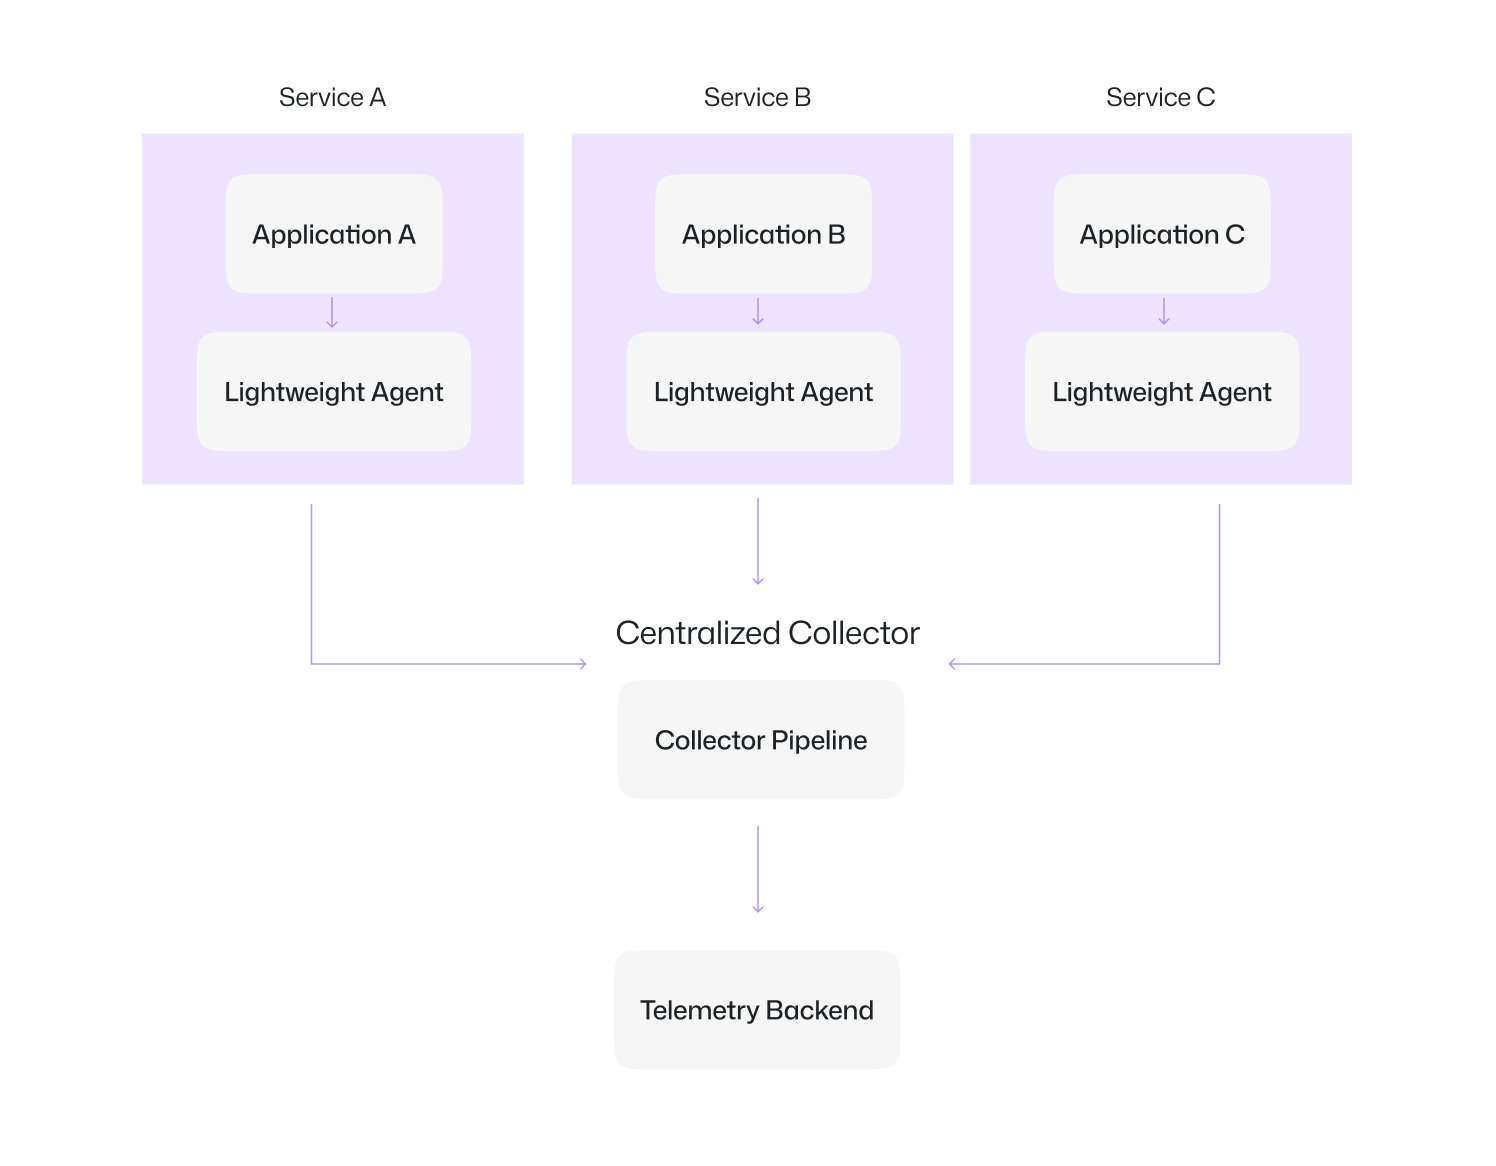
You send everything to the Collector , it sends it wherever you need; it could be one place, many places, or both. To understand the value of the OpenTelemetry Collector, let’s compare what telemetry looks like 'without a collector' and 'with a collector'.
Without a Collector: We have scattered agents that send data directly to the backend. this makes the system harder to scale or change.
With a Collector: Now we have lightweight agents that send data to a central pipeline, which processes and forwards it to any backend.
Core Components and Data Flow
The collector is built around a simple pipeline. Firstly data flows in, it gets processed, and then it flows out.
Three core parts make this possible, these are :
Receivers
Receivers are the entry point. They take in telemetry from many sources: OTLP, Prometheus, Jaeger, fluentforward (Fluentd/Fluent Bit Forward protocol), and even custom logs.
Processors
Processors sit in the middle. They transform or control how data moves. Batch, memory limiter, tail sampling, or attribute processors are common.
processors:
  batch:
  filter/ottl:
    logs:
      log_record:
        - 'severity_number < SEVERITY_NUMBER_ERROR'
YAML snippet: batching and filtering logs to keep only errors
Exporters
Exporters are the exit. They send telemetry to where it belongs. Prometheus, Jaeger, Datadog, Elasticsearch, or even another Collector.
Pipelines
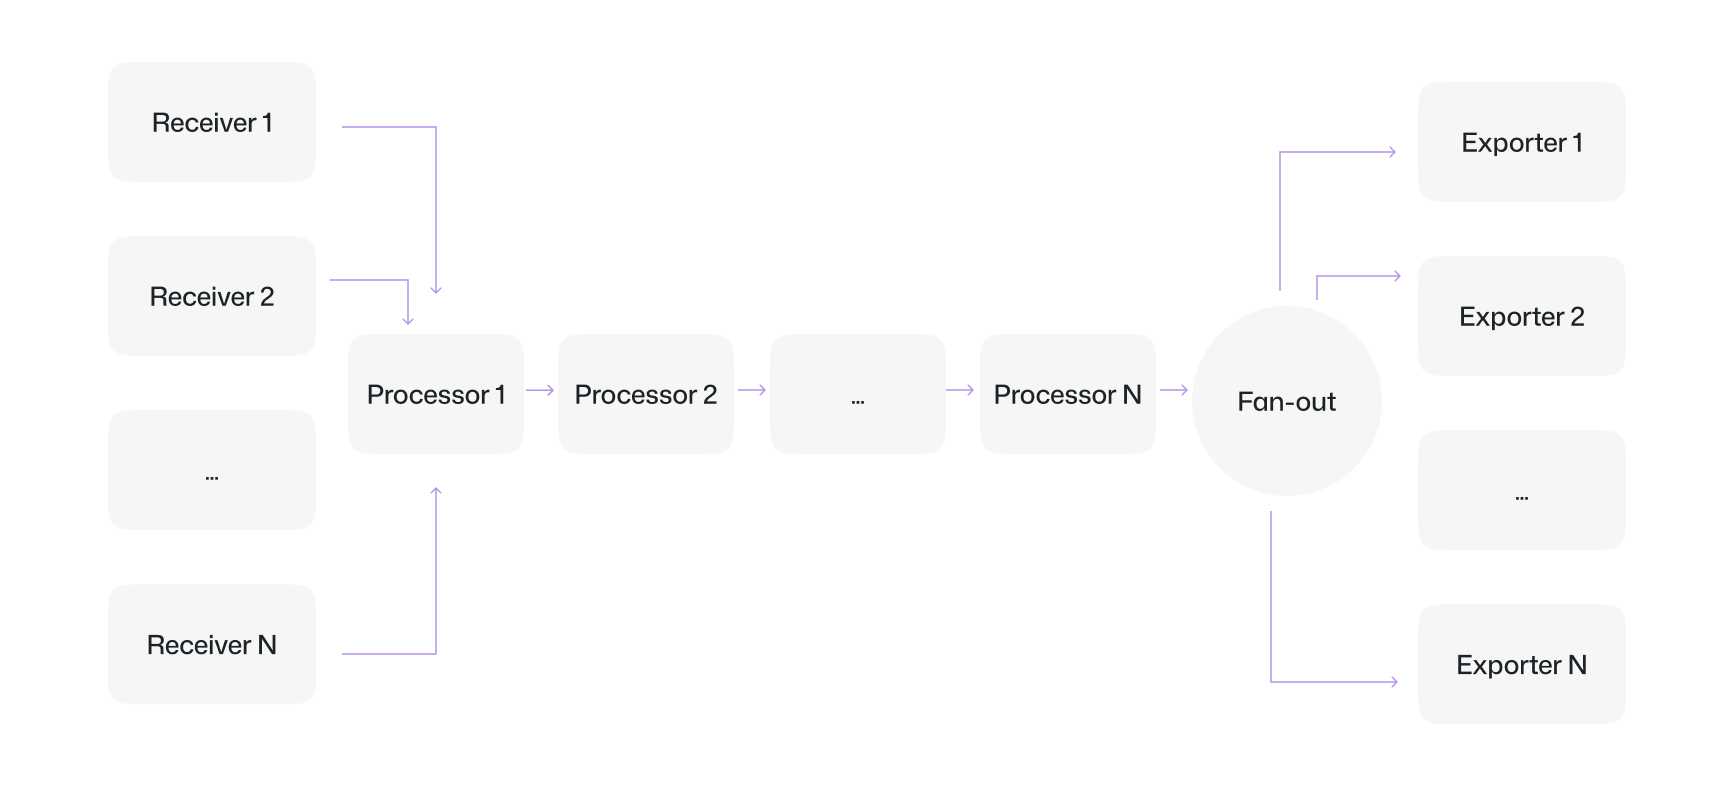
So how do receivers, processors, and exporters connect? That happens through pipelines. If you have multiple receivers, processors, or exporters, the pipeline tells the collector which ones to use for each signal type. This makes it easy to run multiple flows in parallel. Also here each of the pipelines are independent, so you can tune them differently depending on the data type. For example, you might have:
- One pipeline for traces (OTLP receiver → batch processor → Jaeger + Datadog exporters).
- Another pipeline for metrics (Prometheus receiver → memory limiter → Prometheus exporter).
- A third pipeline for logs (Filelog receiver → attributes processor → Loki exporter).
The following diagram represents a typical pipeline:
Flow
Here flow refers to the instructions that we give in the 'pipeline' section of the config that the 'collector' follows . That is how it knows which receiver connects to which processor and which exporter gets the output.
Collector vs. Direct Instrumentation: When to Choose What
'Direct instrumentation' means you add SDKs or agents directly into your application code. This works fine for small setups or when you are just starting out, but has a few limits. Every time you switch vendors or update exporters, you need to do a lot of code changes and redeploys.
The 'Collector' removes that problem. You instrument your code once using OpenTelemetry SDKs. Then you send all telemetry to the Collector. From there, you can route, transform, and export without touching your applications.
exporters:
  jaeger:
    endpoint: jaeger:14250
  datadog:
  api:
    key: ${DD_API_KEY}
    site: datadoghq.com
service:
  pipelines:
    traces:
      receivers: [otlp]
      processors: [batch]
      exporters: [jaeger, datadog]
YAML: sending the same traces to both Jaeger and Datadog.
When to choose direct instrumentation
- Small apps or dev/test environments.
- If you only need one backend.
- When simplicity matters more than flexibility.
When to choose the Collector
- Growing systems with multiple services.
- When you need vendor flexibility.
- When you want filtering, batching, or sampling to cut costs.
- Large-scale production workloads.
Enterprise Architecture Considerations
For the Enterprise architecture, how you deploy the Collector depends on the 'scale' of your systems and what you need from 'telemetry' (i.e the data which are traces, metric and logs). There are three main patterns, and most enterprises end up using some mix of them.
Agent (Sidecar or DaemonSet)
An agent runs close to your application. Running locally lets you capture host-level metadata like CPU, memory, and container labels.
Gateway (Centralized)
A gateway runs as a standalone service or cluster. Applications and agents forward their telemetry to the gateway, which handles heavy lifting, i.e., filtering, sampling, batching, and exporting.
Hybrid
In practice, many enterprises use a hybrid approach: lightweight agents collect data at the edge, and one or more gateways handle advanced processing and multi-backend export.
How to choose
- Use
Agentwhen you want fine-grained, host-level context. - Use
Gatewaywhen you need centralized management, compliance, or cross-team policies. - Use
Hybridwhen you are operating at scale and need both edge collection and central control.
OpenTelemetry Collector Installation & Distribution Strategy
Installing the Collector is not complicated. You can run it in many ways: as a Docker container, a Linux package, a Windows service, or as a pod in Kubernetes. The method depends on your environment and how much control you want.
Choosing the Right Distribution for Production
The community provides three main distributions, and the right choice depends on your workload and security requirements.
Core
The Core build contains only the most stable, critical components. It is small, predictable, and maintained by the OpenTelemetry team.
- Best for teams that want maximum stability.
- Smaller attack surface, fewer moving parts.
Contrib
The Contrib build is the most popular. It includes everything from Core plus a wide set of community-maintained receivers, processors, and exporters (like Kafka, MongoDB, or Redis).
- Best for teams that need flexibility.
- Comes with more integrations out of the box.
Custom Build
With the Collector Builder, you can create your own binary that only includes the components you need.
- Best for enterprises that want to stay lean.
- Cuts down image size and removes unused code paths.
Container Deployment Patterns
The Collector can be deployed in different ways depending on how close you want it to run to your applications. In Kubernetes, there are three common patterns: sidecar, DaemonSet, and standalone (gateway). Each has trade-offs in visibility, control, and resource usage.
Sidecar container
A sidecar runs inside each pod, next to the service container. It captures telemetry right at the source and enriches it with service-level metadata. Like in payments service, sidecars were added to every pod so traces could automatically include the pod and namespace. This made debugging failures much faster.
DaemonSet
A DaemonSet runs one Collector per node. It scrapes metrics, ingests logs, and collects traces for everything running on that node.
apiVersion: apps/v1
kind: DaemonSet
metadata:
  name: otel-collector
spec:
  template:
    spec:
      containers:
        - name: otel-collector
          image: otel/opentelemetry-collector-contrib:latest
          volumeMounts:
            - name: config
              mountPath: /etc/otelcol
      volumes:
        - name: config
          configMap:
            name: otel-collector-config
This snippet defines a DaemonSet so every Kubernetes node gets its own Collector instance.
Like in an e-commerce platform used this pattern to capture node metrics and logs at scale. and then these node-level Collectors forwarded data to a gateway cluster that exported to multiple vendors.
Standalone deployment (Gateway)
A gateway runs as a central Collector service or cluster. All applications forward telemetry to it. It then handles filtering, sampling, batching, and exporting. Like a fintech company used a gateway cluster to enforce compliance rules. Sensitive fields were stripped, and TLS was enforced before data ever left their network.
Kubernetes-Native Deployment
The community provides Helm charts and Operators to simplify running the Collector in Kubernetes. Helm makes it easy to install and configure Collectors quickly while operators go further, adding lifecycle management like rolling upgrades, scaling, and config reconciliation.
A media company used the official OpenTelemetry Helm chart to deploy Collectors across dev, staging, and production clusters. This let them standardize observability setup across all environments in minutes.
Security Hardening During Installation
Security should be built in from the very first deployment:
- Run the Collector as a
non-root user. - Mount configuration files as
read-only. - Use
TLS certificatesfor communication between apps and the Collector. - Limit access with
Kubernetes RBAC policies.
A financial services company enforced TLS on every connection between microservices and the Collector. Even if someone sniffed the traffic inside the cluster, the data was encrypted and unreadable.
Advanced OpenTelemetry Collector Configuration
Configurations for the collector are written in YAML, but the way you design pipelines is what matters the most! The flows that link receivers, processors, and exporters together.
In production, most teams run separate pipelines for traces, metrics, and logs. That way, each type of data can be scaled, filtered, or debugged on its own.
Production-Ready YAML Configuration
A production config typically separates pipelines by signal type. This prevents overlap, makes scaling easier, and keeps troubleshooting clear.
receivers:
  otlp:
    protocols:
      grpc: {}
        endpoint: 0.0.0.0:4317   # default OTLP gRPC
      http: {}
        endpoint: 0.0.0.0:4318   # default OTLP HTTP
  prometheus:
    config:
      scrape_configs:
        - job_name: "k8s"   # Scrape metrics from Kubernetes pods
          kubernetes_sd_configs:
            - role: pod

processors:
  batch: {}                # Group telemetry before exporting
  memory_limiter:
    limit_mib: 2000         # Cap memory usage
    spike_limit_mib: 500    # Allow short bursts

exporters:
  logging: {}               # Log data (useful for testing)
  prometheus:
    endpoint: "0.0.0.0:9464" # Expose metrics to Prometheus

service:
  pipelines:
    traces:
      receivers: [otlp]
      processors: [batch, memory_limiter]
      exporters: [logging]
    metrics:
      receivers: [prometheus]
      processors: [batch]
      exporters: [prometheus]
What this config does
- OTLP receiver handles traces from services.
- Prometheus receiver scrapes Kubernetes metrics.
- Batch + memory_limiter processors keep data efficient and prevent OOM crashes.
- Separate pipelines ensure traces and metrics are handled independently.
A retail company set up pipelines this way. Metrics went into Prometheus for dashboards, while traces flowed through OTLP for debugging checkout latency. Because pipelines were separate, they scaled metrics independently during Black Friday traffic without affecting traces.
Environment Variables and Secret Management
It's preferred not to hardcode API keys or tokens into configs. Instead, use environment variables or mount them via Kubernetes Secrets.
- Use environment variables for API keys and tokens.
- Mount secrets via Kubernetes Secrets or Docker secrets.
exporters:
  datadog:
    api:
      key: ${DD_API_KEY}
Here, the Collector reads the Datadog API key from an environment variable at runtime.
A SaaS company stored keys in Kubernetes Secrets and injected them into pods as environment variables. This kept credentials out of Git and reduced the chance of accidental leaks.
Multi-Tenant Configuration Strategies
Multi-Tenant configuration strategies refers to the strategies via which we can isolate data as well as resources for multiple customers (who are independent) within a single application instance. Large organizations often run one Collector for multiple teams or environments. Its goals include:
- Isolation: to keep tenants from impacting or seeing each other.
- Control: per-tenant policy (limits, sampling, redaction).
- Cost/Chargeback: attribute usage to tenants reliably.
- Compliance: route/retain per tenant + region.
Configuration Validation and Testing
Bad YAML can bring down telemetry pipelines. Thus it's important to always validate configs before rollout.
- Run
otelcol validate config.yamlto catch syntax errors. - Test in staging with the
loggingexporter. - And finally deploy through CI/CD so changes are tracked and reviewed.
Here's a case study that might help you : A SaaS startup was rolling out a new observability pipeline for customer-facing APIs. During a Friday evening deploy, an engineer accidentally misconfigured the OTLP receiver in config.yaml by setting the HTTP protocol to an integer instead of a map. In production, this would have broken all trace ingestion.
Fortunately, when they ran:
otelcol validate config.yamlThe collector immediately flagged the problem:
Error: cannot unmarshal !!int `123` into config.HTTPServerSettings
2025-09-01T18:42:10.012+0530    error   service/collector.go:233   Failed to load config: cannot unmarshal !!int `123` into config.HTTPServerSettings
That single validation step in staging saved them from pushing a faulty release and prevented a weekend-long outage in their telemetry pipeline.
OTel Collector Components: Receivers, Processors & Exporters
The collector is built around a simple idea. Around this pipeline, you can plug in extensions that add extra capabilities for running it in production.
Receiver Configuration for Enterprise Data Sources
Receiver config for enterprise data sources means how an enterprise system is set up to ingest, parse, and manage incoming data from different sources (these include databases, SaaS apps, APIs, event streams, logs, etc.).
For instance:
- OTLP receivers accept telemetry in the standard OpenTelemetry format, often sent over gRPC or HTTP.
- Prometheus receivers scrape metrics, just like a Prometheus server would.
- Filelog receivers read raw log files, such as container logs on Kubernetes nodes.
A simple configuration might look like this:
receivers:
  otlp:
    protocols:
      grpc: {}
      http: {}
  prometheus: {}
  filelog:
    include: [ /var/log/containers/*.log ]
Here:
otlpaccepts traces and metrics through gRPC and HTTP.prometheusscrapes metrics.filelogtails logs directly from container log files.
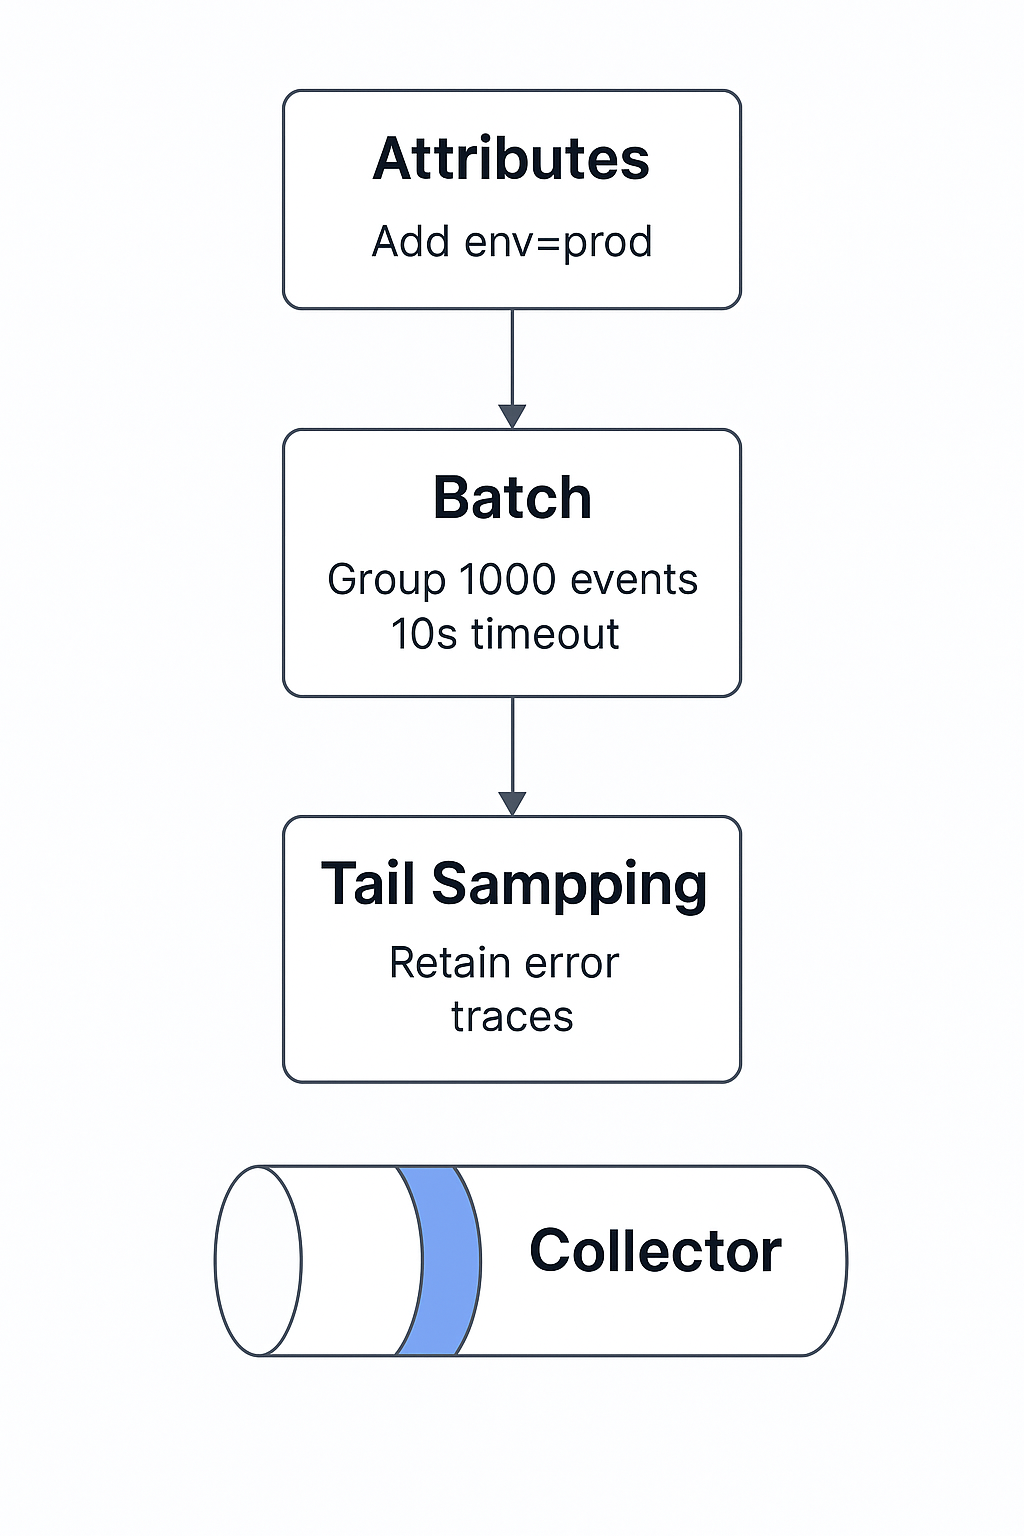
Processor Chains and Data Transformation
A processor chain is a sequence of processors that is applied to incoming telemetry. They transform the data so that it becomes more useful, compliant and cost effective.
Here is a short example:
processors:
  attributes:
    actions:
      - key: env
        value: prod
        action: insert
  batch:
    send_batch_size: 1000
    timeout: 10s
  tail_sampling:
    policies:
      - name: errors
        type: status_code
        status_code: ERROR
Line by line:
attributesadds an env=prod tag so you always know which environment telemetry came from.- batch groups telemetry before sending it, which reduces network overhead.
tail_samplingonly keeps error traces, so you are not overwhelmed with millions of successful requests.
The diagram below illustrates a processor chain where attributes, batching, and tail sampling shape telemetry before reaching the Collector :
Exporter Strategies for Multiple Backends
When exporting telemetry that is needed by different teams or tools, we have exporter strategies for multiple backends. Here are few ways via which we can use these exporters in better ways:
- Role-based separation - In this you may want to export the same data to different backends depending on who is consuming the data.
Engineers → Prometheus for debugging
Managers → Datadog for incident tracking
Compliance → Loki or Elasticsearch for log retention - Redundancy & Reliability - Export the same data to two or more backends of the same type to avoid vendor lock-in or the risk of downtime.
An example of this is: metrics → Prometheus and Datadog. - Cost Optimization - Route full fidelity data to an internal backend (Loki, for example) and then send either sample or aggregated data to a paid SaaS like Datadog.
- Environment-specific routing - You may send development/test data to lightweight backends (Prometheus, local Loki) but have production streams go to one of the enterprise tools (Datadog, New Relic).
here's a minimal config example for you to understand this better:
exporters:
  prometheus: {}
  datadog: {}
  otlphttp/loki:
    endpoint: http://loki:3100/otlp
Extension Components for Operational Excellence
Extensions add support features around the pipeline. They don’t process telemetry directly, but they make the Collector easier and safer to run in production.
Common extensions include:
- Health check: provides a ‘/health’ endpoint so Kubernetes knows when to restart a failing Collector.
- Pprof: lets you profile CPU and memory usage when debugging performance issues.
- Zpages: shows which pipelines are active and what they are doing.
- Authentication: secures outbound communication with basic auth, TLS, or OAuth.
A regulated bank enabled health checks so Collectors could be restarted automatically if they failed. During one incident, they used pprof to confirm that high CPU usage came from a third-party exporter. This proved the issue wasn’t in their cluster and saved hours of troubleshooting.
extensions:
  health_check:
    endpoint: "0.0.0.0:13133"
  pprof:
    endpoint: "0.0.0.0:1777"
  zpages:
    endpoint: "0.0.0.0:55679"
  basicauth/client:
    client_auth:
      username: ${BASIC_USER}
      password: ${BASIC_PASS}

exporters:
  otlphttp:
    endpoint: http://example:4318
    auth:
      authenticator: basicauth/client

service:
  extensions: [health_check, pprof, zpages, basicauth/client]
  pipelines:
    logs:
      receivers: [otlp]
      processors: [batch]
      exporters: [otlphttp]
Use case: A regulated bank enables health checks for Kubernetes probes, uses pprof for runtime profiling, and secures outbound calls with basic auth.
Performance Optimization and Scaling
The Collector is powerful, but like any service it needs to be tuned for stability and efficiency. Without limits, it can use too much memory, flood exporters, or become a bottleneck. Let’s look at how to optimize it for production.
Memory and CPU Optimization
The Collector can use a lot of resources under heavy traffic. To prevent this, you set limits so it doesn’t crash your nodes.
Here’s a simple config:
processors:
  memory_limiter:
    limit_mib: 2000
    spike_limit_mib: 512
Here
limit_mibcaps memory use at 2 GB.spike_limit_miballows short bursts up to 512 MB before throttling.
During peak hours, a marketplace noticed memory spikes that killed their Collector pods. By adding a memory limiter, they kept pods stable and prevented OOM errors.
Batch Processing Configuration
Exporters perform better when data is sent in groups instead of one record at a time. That is why batching is a must in production.
processors:
  batch:
    send_batch_size: 1000
    timeout: 5s
Here:
send_batch_sizemeans up to 1000 items are sent at once.timeoutensures data is sent at least every 5 seconds, even if the batch is smaller.
An online game studio saw their exporter costs drop when they enabled batching. Instead of sending thousands of tiny requests, the Collector grouped them, lowering network overhead and improving throughput.
High-Availability Deployment Patterns
In production, a single Collector is risky. If it fails, you lose visibility. Running multiple replicas ensures redundancy.
For example, a Kubernetes deployment might use three replicas of the Collector behind a service. Kubernetes readiness probes check /health, and if one replica fails, traffic automatically shifts to the others.During an incident at a fintech company, one Collector crashed due to a faulty exporter. Because replicas were running, data flow continued through the other pods, and there was no outage in monitoring.
Load Balancing and Horizontal Scaling
As telemetry volume grows, you often need more than one Collector. Load balancing spreads data across multiple replicas, while horizontal scaling lets Kubernetes add or remove pods automatically.
For example, a streaming platform doubled in traffic during a live event. With a Kubernetes Horizontal Pod Autoscaler, new Collector pods spun up as CPU crossed 70 percent. Exporter queues stayed healthy, and telemetry pipelines never dropped data.
There are a few ways to do this.
Option 1: Client load balance
The simplest way is to point your applications at a Kubernetes Service that fronts multiple Collector pods. Each request is automatically balanced across replicas.
apiVersion: v1
kind: Service
metadata:
  name: otel-gateway
spec:
  selector:
    app: otel-gateway
  ports:
    - name: otlp-grpc
      port: 4317
      targetPort: 4317
  type: ClusterIP
Here:
- The Service groups all pods labeled
otel-gateway. - Applications send telemetry to port 4317 using OTLP over gRPC.
- Kubernetes spreads requests evenly across replicas.
This is efficient because OTLP gRPC is designed for high-throughput streaming
Example: During peak traffic, a payment platform ran three Collector replicas behind a Service. Applications kept sending traces to the same endpoint, but load was balanced automatically across pods.
Option 2: Internal sharding
Sometimes balancing at the client level isn’t enough. In those cases, you shard internally. This means splitting pipelines or exporters inside the Collector itself.
For instance, you might run multiple exporters for the same signal type and spread the load between them. Or you might configure separate pipelines so traces and metrics are processed independently.
Option 3: Horizontal autoscaling
When traffic isn’t predictable, Kubernetes can scale the Collector automatically with an HPA (Horizontal Pod Autoscaler).
apiVersion: autoscaling/v2
kind: HorizontalPodAutoscaler
metadata:
  name: otel-gateway-hpa
spec:
  scaleTargetRef:
    apiVersion: apps/v1
    kind: Deployment
    name: otel-gateway
  minReplicas: 3
  maxReplicas: 10
  metrics:
    - type: Resource
      resource:
        name: cpu
        target:
          type: Utilization
          averageUtilization: 70
Here:
- The HPA starts with 3 Collector pods.
- If CPU usage goes above 70 percent, Kubernetes adds more pods, up to 10.
- When traffic drops, pods are scaled back down.
Example: A streaming platform doubled traffic during live events. Their HPA automatically scaled Collectors from 3 to 8 pods, while the Service spread load evenly. Exporter queues stayed healthy, and telemetry never dropped.
Security and Compliance Best Practices
The Collector often handles sensitive data. Logs may contain user details, traces may show payment flows, and metrics can reveal internal systems. If that data leaks, the impact is serious, and could lead to fines, downtime, and broken trust.
Here are four areas to secure before running in production.
Data Privacy and Sensitive Information Filtering
First, stop sensitive data from leaving your systems.Imagine a span that carries a ‘user.ssn’ attribute or logs with a raw ‘card_number’. If that ends up in a vendor backend, you have a compliance nightmare.
The fix: add an attributes processor to delete or mask those fields.
processors:
  attributes:
    actions:
      # Delete the SSN field
      - key: user.ssn
        action: delete
      # Delete card numbers
      - key: card_number
        action: delete
      # Mask email addresses
      - key: email
        action: update
        value: "[redacted]"
Here’s what this does:
- If telemetry comes in with
user.ssn, it gets dropped. - If a
card_numberappears, it is removed. - Emails are replaced with
[redacted].
A healthcare startup had spans carrying patient IDs. By adding this processor, they stripped those fields before exporting to Datadog. They passed their HIPAA audit with this simple change.
Network Security and TLS Configuration
Now let’s secure the pipes.
Telemetry is just data in transit. Without TLS, anyone sniffing your network could read it.That is unacceptable in finance, healthcare, or even a basic SaaS.
You can enable TLS on both the receiver and exporter sides.
receivers:
  otlp:
    protocols:
      grpc:
        tls:
          cert_file: /etc/otel/tls/tls.crt
          key_file: /etc/otel/tls/tls.key
This snippet means:
- The Collector only accepts gRPC traffic encrypted with your certificate.
- Any client sending data must trust that cert.
For outbound, do the same with exporters:
exporters:
  otlphttp:
    endpoint: https://apm.vendor.example
    headers:
      x-api-key: ${VENDOR_KEY}
Now every trace leaving your cluster travels over HTTPS.
A fintech’s compliance team demanded “encryption in transit everywhere”. With TLS turned on in the Collector, they proved all telemetry paths were secure, even between internal services.
Audit Logging and Compliance Monitoring
Auditors love logs. You need to show not just what telemetry you send but also how the Collector itself behaved.
Three steps:
- Store your Collector config in Git (so you know who changed what and when).
- Enable logging exporters in staging to validate pipelines.
- Expose health and profiling endpoints so you can inspect the collector under load.
extensions:
  health_check:
    endpoint: "0.0.0.0:13133"
  pprof:
    endpoint: "0.0.0.0:1777"
  zpages:
    endpoint: "0.0.0.0:55679"
This adds:
/health→ Kubernetes can check if the Collector is alive: Kubernetes uses this endpoint to know if the Collector is healthy and ready to serve traffic. Without it, a broken Collector could stay in your cluster silently dropping data./debug/pprof→ profile CPU and memory: This endpoint lets you profile the Collector’s CPU and memory in real time. During an incident, it shows you if a processor is leaking memory or if an exporter is burning too much CPU./debug/servicez(zpages) → See active pipelines: This gives you a live view of all pipelines running inside the Collector. It confirms whether receivers, processors, and exporters are working as expected.
During an incident, you might notice the Collector chewing up memory. With the /debug/pprof endpoint, you can capture a profile and see exactly which processor or exporter is at fault. One team I worked with discovered a vendor exporter was leaking memory without pprof, they would have blamed their own cluster.
RBAC and Access Control
Access to the Collector has to be locked down. If anyone in your org can edit its configuration, you will eventually run into outages or misconfigured exporters.In Kubernetes, the right way is to give the Collector its own service account and apply RBAC rules around it.
apiVersion: v1
kind: ServiceAccount
metadata:
  name: otel-collector
  namespace: observability
---
apiVersion: rbac.authorization.k8s.io/v1
kind: Role
metadata:
  name: otel-editor
  namespace: observability
rules:
  - apiGroups: [""]
    resources: ["configmaps"]
    verbs: ["get", "list", "update"]
---
apiVersion: rbac.authorization.k8s.io/v1
kind: RoleBinding
metadata:
  name: otel-editors
  namespace: observability
subjects:
  - kind: User
    name: sre.lead@company.com
roleRef:
  kind: Role
  name: otel-editor
  apiGroup: rbac.authorization.k8s.io
RBAC rules restricting Collector access to ConfigMaps in the observability namespace
What this does
- The Collector runs with its own identity (‘otel-collector’ service account).
- A Role allows access to only ConfigMaps in the ‘observability’ namespace.
- A RoleBinding ties that permission to a specific user (sre.lead@company.com).
Now think of what happens during an incident if too many people have edit rights. In one large retailer, junior developers were able to change the production Collector. Exporters were randomly updated mid-incident, which only made outages worse. After RBAC was applied properly, only SRE leads had access, and every config change went through Git and CI first.
OTel Collector Monitoring and Observability
Running the Collector without monitoring it is risky. If it fails, you could lose all your telemetry without noticing. You need ways to watch its health, measure performance, and debug when things go wrong.
Self-Monitoring and Health Checks
The Collector can expose a /health endpoint. Kubernetes can call this endpoint to decide if the pod is ready or if it should be restarted.
Why this matters: without it, the Collector could crash or stall and still appear running. You would only realize after your dashboards go blank. With /health wired into readiness and liveness probes, Kubernetes restarts it before data loss spreads.
During one outage, a team caught a failing Collector quickly because the /health probe failed and Kubernetes pulled it out of service automatically. Without that, they would have silently dropped thousands of traces.
Metrics Collection and Analysis
The Collector can emit its own internal metrics, usually scraped by Prometheus. These metrics cover CPU, memory, exporter queue sizes, and dropped spans.
Why this matters: you can detect bottlenecks before they take down your pipelines. A rising exporter queue signals backpressure. High memory usage hints at batch sizes that are too large.
For example, an SRE team once noticed that trace batches were queuing up. Exporter latency kept rising. By checking the Collector’s own metrics, they traced it back to a misconfigured tail-sampling policy and fixed it before the queue overflowed.
Troubleshooting Common Issues
When data does not show up in the backend, the Collector should be the first thing you check.
- Look at its logs with the logging exporter.
- Use debug processors to print spans or metrics.
- Confirm pipelines are active through the ‘/debug/servicez’ endpoint.
Imagine a developer complaining, “traces are missing.” By checking /debug/servicez, you might see that the OTLP receiver was not even enabled in the running config. Instead of chasing network issues, you fix the config, and telemetry starts flowing.
Performance Profiling and Debugging
Sometimes the Collector runs but consumes too much CPU or memory. That is when /debug/pprof comes in. It lets you capture a live profile and see which processor or exporter is heavy.
During a production incident, engineers noticed high memory usage in the Collector. By running a pprof profile, they confirmed the issue came from a vendor exporter. That evidence helped them open a support ticket and avoid wasted time blaming their own pipelines.
Enterprise Integration Patterns
The Collector is rarely deployed alone. In production, it has to fit into your existing monitoring, CI/CD, and disaster recovery setup. Once done right, it becomes a stable bridge between your apps and your observability stack.
Integrating with Existing Monitoring Infrastructure
Most companies already run tools like Prometheus, Grafana, Datadog, or Splunk. The Collector plugs into these as a central router.
Why this matters: instead of running separate agents for every tool, you feed everything into the Collector and then export wherever needed.
For example, one SaaS team exported metrics to Prometheus for engineers while also streaming the same data to Datadog for executives. Without the Collector, they would have duplicated instrumentation in every service.
CI/CD Pipeline Integration
Collector configs should be treated like code. That means storing YAML in Git, testing changes in staging, and rolling them out via CI/CD.
Why this matters: hand-editing configs in production is risky. One wrong line can break the entire telemetry pipeline. With CI/CD, every change is versioned, peer-reviewed, and validated before rollout.
During a real deployment, a company accidentally dropped traces by misplacing a processor line in YAML. After moving configs into CI/CD, errors like that were caught in automated validation before reaching production.
Disaster Recovery and Backup Strategies
If you lose Collector configs, you lose your observability pipeline. That can leave you blind during outages.
The fix is simple: back up configs in Git and automate recovery. Some teams even keep “golden configs” that can be rolled out fast when incidents hit.
One enterprise once faced a full telemetry outage because a faulty update wiped their Collector ConfigMap. Restoring from Git took minutes instead of hours, keeping SREs from flying blind during an incident.
Cost Optimization Strategies
Telemetry volume grows fast, and so do bills. The Collector helps by filtering, sampling, and aggregating before data ever reaches a vendor.
Why this matters: instead of exporting every single trace, you can keep only what matters. Batch processors also reduce vendor API calls, saving cost.
For instance, a gaming company cut costs by half by using tail sampling to keep only failed requests and critical traces. Engineers still got the insights they needed, but storage and vendor bills went down dramatically.
Real-World Use Cases and Implementation Examples
The value of the Collector shows best in real environments. Here are some common scenarios where teams rely on it.
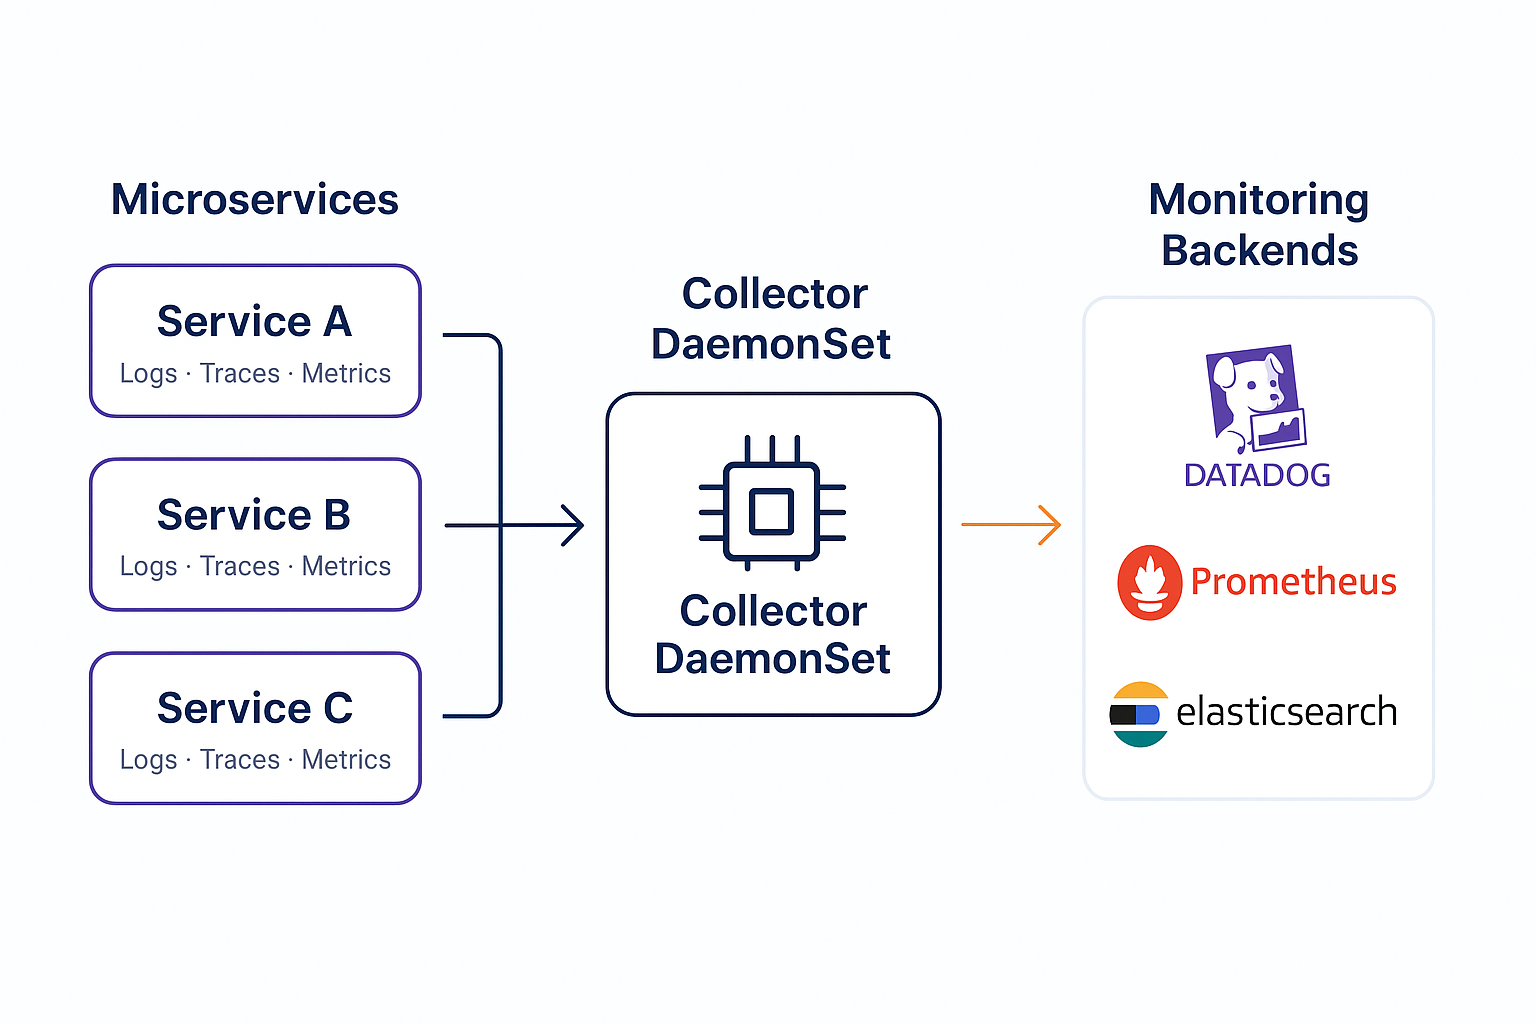
Microservices Architecture Monitoring
Microservices generate a storm of telemetry: each service logs, traces, and reports metrics differently. Without a central pipeline, you end up with a tangled mess of agents.
With the Collector, all services send telemetry to a local agent or sidecar, which then forwards to a gateway. The gateway handles filtering, batching, and exporting.
During one migration, an online retailer moved to Kubernetes with 50+ microservices. By dropping a Collector DaemonSet on every node, they unified all logs and traces. The developers kept coding normally, while SREs controlled the telemetry flow in one place.The diagram below shows how microservices send telemetry through a Collector DaemonSet and gateway Collector before reaching backends like Datadog, Prometheus, and Elasticsearch:
Multi-Cloud and Hybrid Deployments
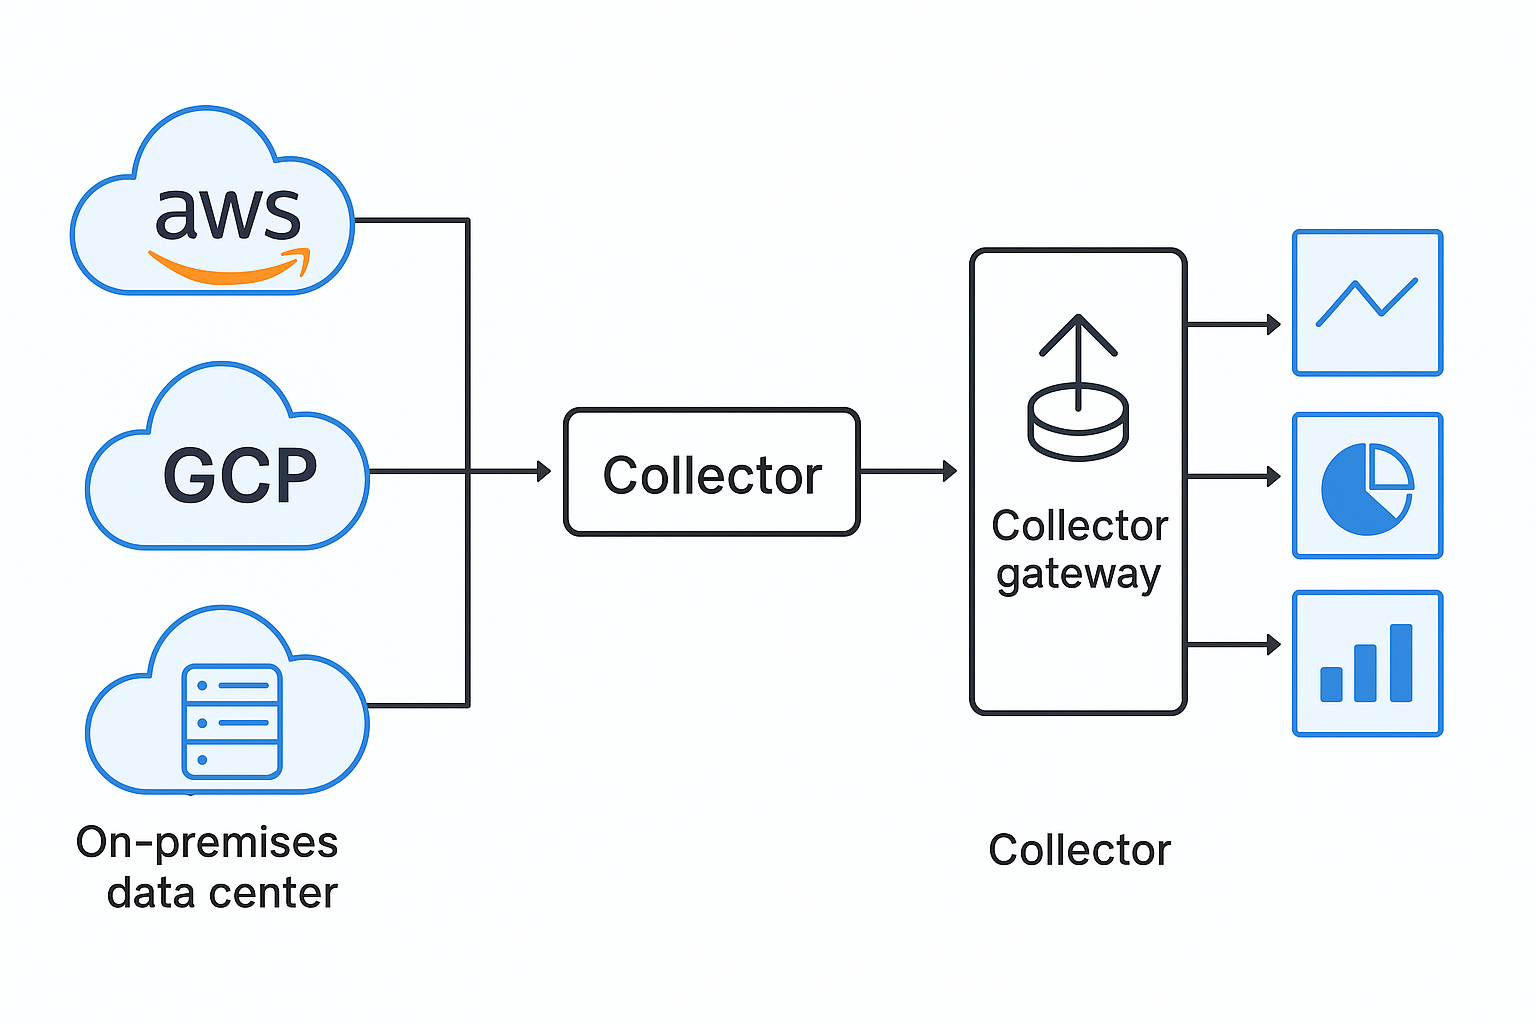
Many companies run across AWS, GCP, and on-prem data centers. Each platform comes with its own monitoring agents. Running all of them leads to duplication and chaos.
The Collector solves this by acting as the common layer. Apps and hosts in every environment send data to a local Collector, which then forwards to a central gateway. Exporters handle sending data to multiple monitoring systems.
A financial services company used this approach to unify observability across AWS and on-prem mainframes. Instead of managing three different agents, they managed one set of Collector configs.
Here’s how a Collector gateway unifies telemetry from AWS, GCP, and on-prem into one pipeline:
Regulated Industry Requirements
In healthcare, finance, or government, compliance is strict. Telemetry may include personal or financial data. The Collector makes it easier to enforce privacy rules in one place.
For example, by using processors, sensitive attributes can be deleted before data leaves the cluster. Audit logging and RBAC ensure only a small team can change configs.
A healthcare startup avoided HIPAA violations by masking patient IDs inside the Collector. The apps stayed unchanged, but the compliance box was checked.
Here’s an example of how the Collector can redact sensitive fields before exporting telemetry:
Before (raw log with patient ID):
{
  "timestamp": "2024-08-12T14:22:31Z",
  "patient_id": "123456789",
  "status": "checked_in"
}
After (Collector redacts sensitive field):
{
  "timestamp": "2024-08-12T14:22:31Z",
  "patient_id": "[redacted]",
  "status": "checked_in"
}
Large-Scale Production Deployments
At scale, data volume can grow beyond what backends can handle. The Collector helps with batching, sampling, and scaling horizontally.
During a streaming event, a media company saw telemetry traffic spike to 5x normal. Exporters started to back up. With Collectors scaled out behind a load balancer and batch processors tuned, they absorbed the spike without losing visibility.
Troubleshooting and Operational Excellence
Even with the right setup, issues will come up. The Collector is at the center of your observability stack, so when it misbehaves, you lose visibility. Knowing how to troubleshoot quickly keeps you from flying blind during incidents.
Common Configuration Errors and Solutions
Most failures in the Collector come down to bad YAML. A missing processor, wrong indentation, or unsupported exporter can break pipelines.
For example, an SRE team rolled out a config and noticed no traces were reaching Jaeger. On inspection, the exporters block was indented incorrectly. Fixing the YAML brought everything back online.
Tip: always run ‘otelcol validate’ before deploying configs. It catches syntax mistakes that are easy to miss.
Performance Debugging Methodologies
Sometimes the Collector runs but consumes too many resources. Exporter queues grow, memory spikes, or CPU burns hot.
During a production load test, engineers noticed exporter queues climbing steadily. By checking the Collector’s internal metrics, they saw that batches were too large. Reducing batch size stabilized the system and cut latency.
The method:
- Check internal metrics like
exporter_queue_sizeandprocessor_batch_batch_send_size. - Use
/debug/pprofto profile CPU or memory. - Tune processors (batch size, memory limiter).
Incident Response with OTel Collector
When an outage happens, the Collector is often in the spotlight. Is it dropping data? Is a backend unreachable?
During one outage, dashboards went blank and SREs suspected backend failure. Checking the Collector logs showed retries failing due to expired API keys. Rotating the keys brought telemetry back without needing to restart services.
The lesson: always check the Collector first in telemetry outages. It often points to the root cause faster than chasing each service.Here’s how a misconfigured exporter appears in OTel Collector logs.
receivers:
  filelog:
    start_at: beginning
    include:
      - ../../local/app.log

exporters:
  datadog:
    api:
      key: xyz

service:
  pipelines:
    logs:
      receivers: [filelog]
      exporters: [datadog]
Log Output:
Error: failed to build pipelines: failed to create "datadog" exporter for data type "logs": failed to create logs agent: Invalid endpoints: could not parse https://http-intake.logs.datadoghq.com: strconv.Atoi: parsing "//http-intake.logs.datadoghq.com": invalid syntax
2024/05/22 14:33:20 collector server run finished with error: failed to build pipelines: failed to create "datadog" exporter for data type "logs": failed to create logs agent: Invalid endpoints: could not parse https://http-intake.logs.datadoghq.com: strconv.Atoi: parsing "//http-intake.logs.datadoghq.com": invalid syntax
This makes it immediately clear that the root cause was a misconfigured Datadog API key, without needing to inspect each service individually.
Maintenance and Upgrade Strategies
The Collector evolves quickly. New processors and exporters appear with every release. Running old versions means missing fixes or leaving security holes.
A global SaaS provider scheduled upgrades every quarter. They tested new versions in staging with synthetic traffic before promoting to production. This kept them current without surprises.
Tip: subscribe to the OpenTelemetry release notes. Review breaking changes before upgrading.
OpenTelemetry Collector FAQ Questions
Q: What is the OpenTelemetry Collector and why do I need it?
It is a vendor-neutral service that receives, processes, and exports telemetry data. Instead of running multiple agents, you use one pipeline that can send data anywhere.
Q: How do I configure OpenTelemetry Collector for production?
Use YAML configs with separate pipelines for logs, metrics, and traces. Add processors like ‘batch’ and ‘memory_limiter’. Always validate configs with ‘otelcol validate’ before rollout.
Q: What’s the difference between OTel Collector distributions?
- Core → minimal, stable features.
- Contrib → includes community-supported receivers and exporters.
- Custom → built with the Collector Builder for only the components you need.
Q: How do I monitor OpenTelemetry Collector health and performance?
Expose ‘/health’ for Kubernetes probes, use Prometheus to scrape internal metrics, and check ‘/debug/servicez’ or ‘/debug/pprof’ when troubleshooting.
Q: What are the security best practices for OTel Collector deployment?
Encrypt traffic with TLS, remove sensitive fields with processors, restrict access with RBAC, and log changes through Git or CI/CD.
Q: How do I scale OpenTelemetry Collector for high-volume environments?
Run multiple replicas behind a load balancer. Use batching, memory limits, and autoscaling policies in Kubernetes to absorb traffic spikes.
Q: What processors should I use in my OTel Collector pipeline?
Start with ‘batch’ to group data efficiently, ‘memory_limiter’ to prevent OOM, and ‘attributes’ to add metadata. Add ‘tail_sampling’ to cut down costs by filtering traces.
Q: How do I integrate OpenTelemetry Collector with my existing monitoring tools?
Add exporters for Prometheus, Datadog, Jaeger, or Splunk. The same data can be routed to multiple backends without changing application code.
Q: What are common OpenTelemetry Collector configuration errors?
YAML indentation mistakes, missing pipelines, or unsupported exporters. Always run validation before deploying.
Q: How do I back up and restore OpenTelemetry Collector configurations?
Keep configs in Git. Store secrets in Kubernetes Secrets or environment variables. During an outage, redeploy known-good configs directly from version control.
