Real-time Incident Management with Hosted Graphite

Last updated
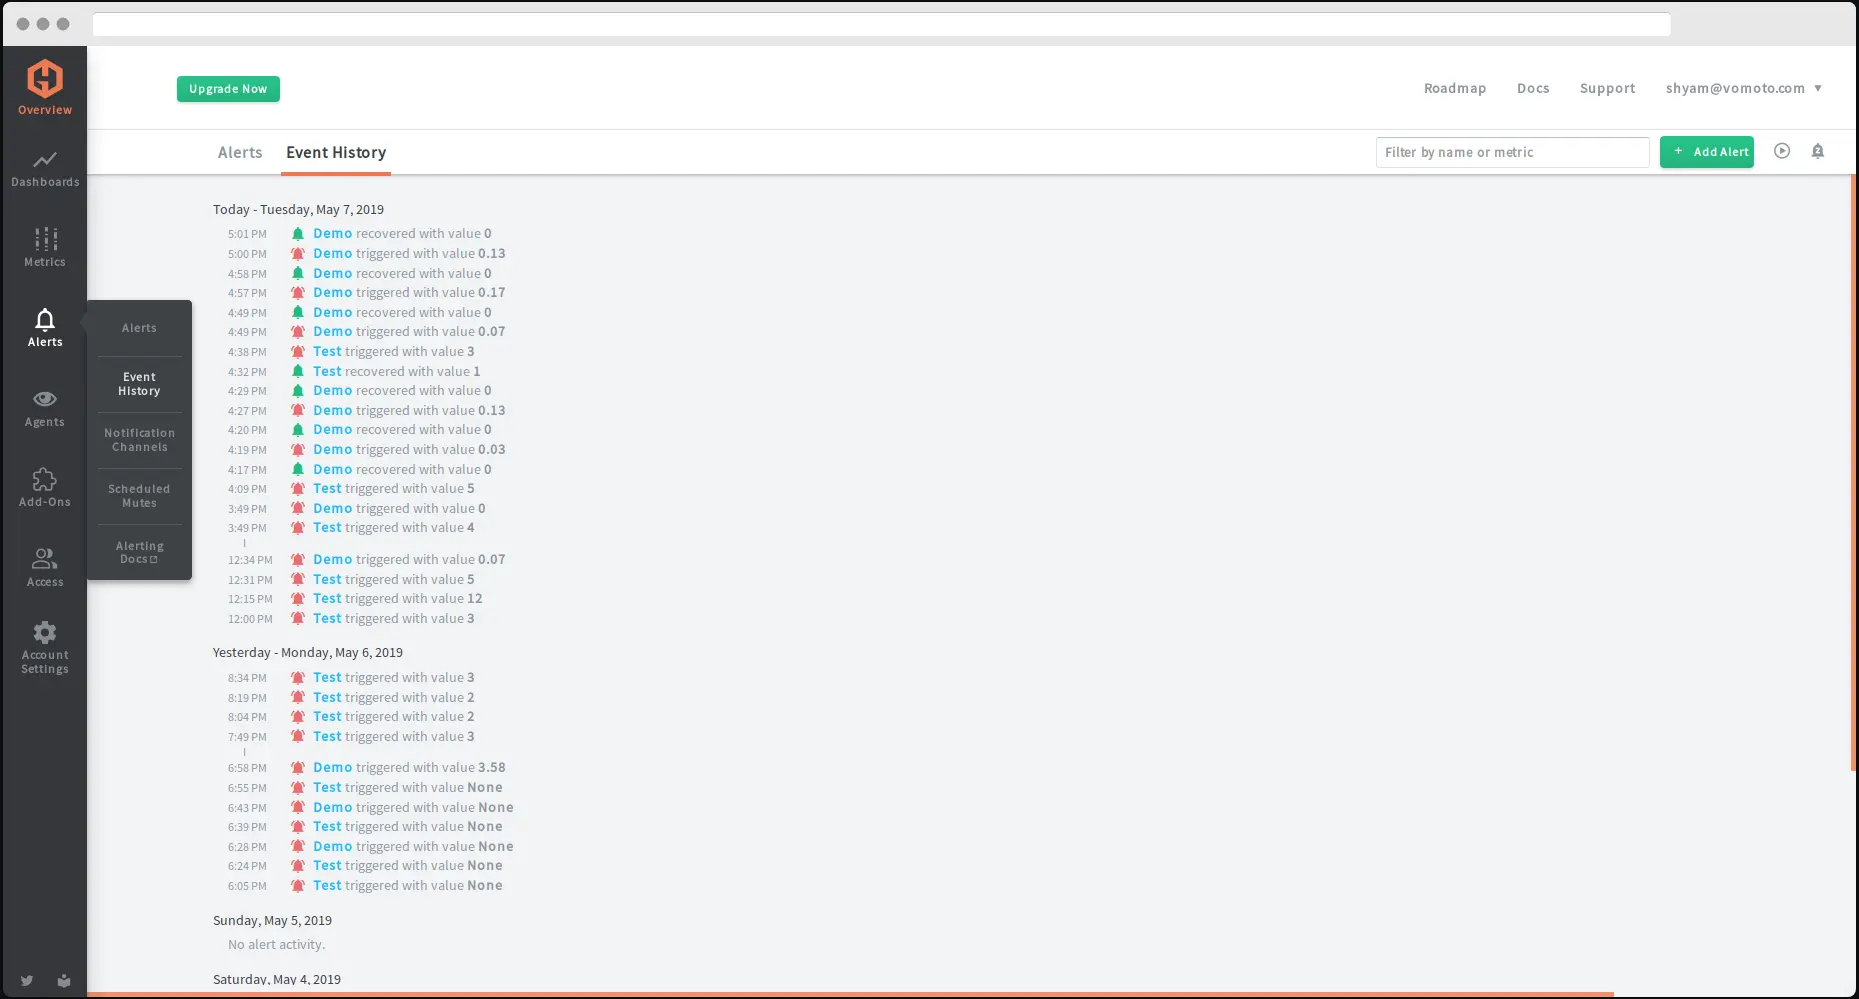
Incident management works best when all of your incidents and alerts can be tracked from a centralized hub. Hosted Graphite is a graphite monitoring, alerting and Grafana dashboard platform for engineers. It enables monitoring websites, apps and servers.
The Zenduty-Hosted Graphite integration allows you to sync your Hosted Graphite tickets with Zenduty, and keep up with all the updates. The advanced monitoring allows you to keep a bird’s eye view on all the updates.
Scroll to the end of the page for complete instructions to set up the integration. Read more on Zenduty Docs
Actions:
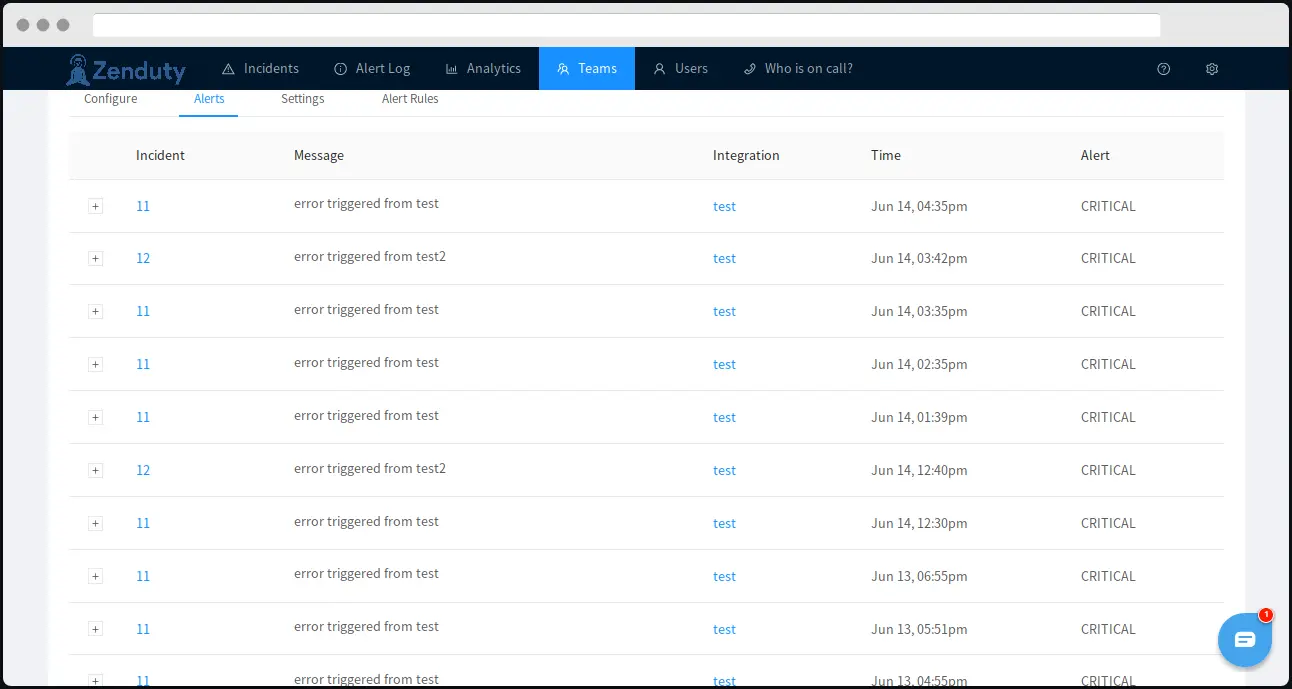
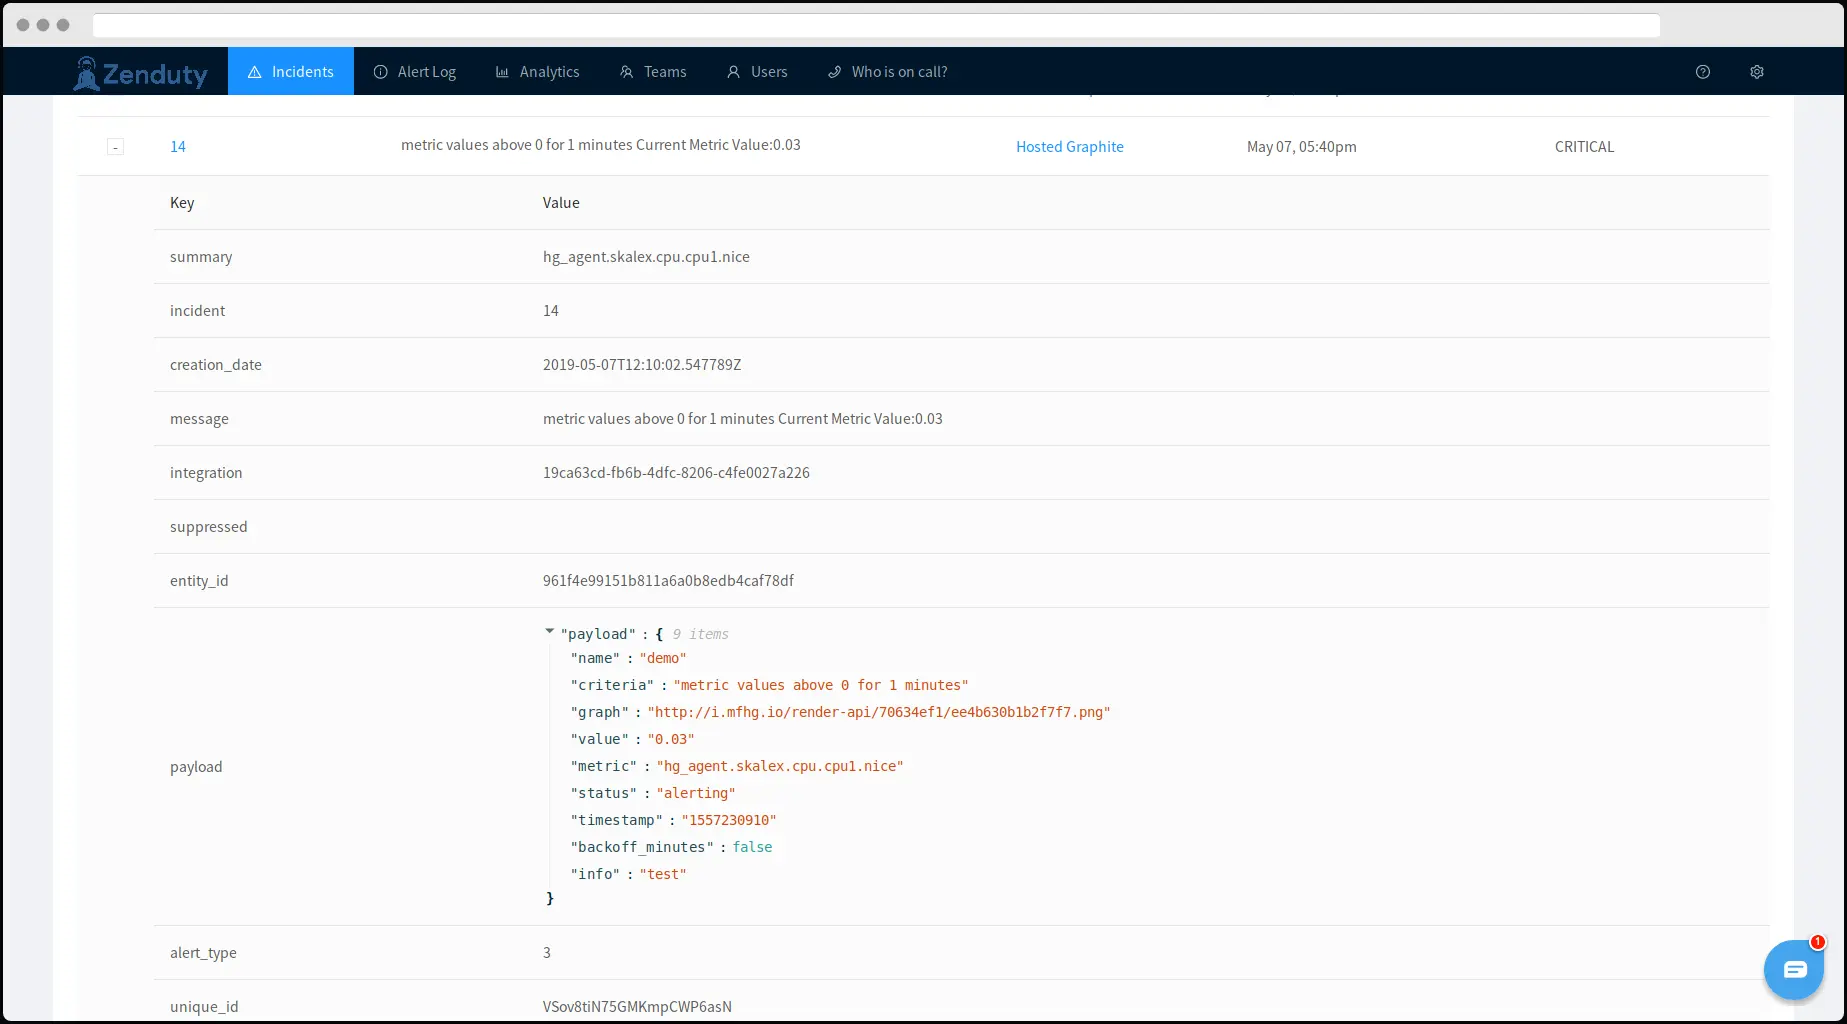
Once set up, users in Zenduty will get their incidents from their errors in Hosted Graphite. Any action on either application will reflect in the other.
| Hosted Graphite Action | Zenduty Response |
|---|---|
| New error generated | New incident created |
| Error resolved | Incident resolved |
A New error in Hosted Graphite creates a corresponding new incident in Zenduty


Resolution of a Hosted Graphite Error resolves the Zenduty Incident

When you delete the integration, make sure to also delete the Zenduty Webhook URL you added in Lightstep. This is to prevent Zenduty updates from being posted to Hosted Graphite anymore.
Steps to Integrate:
In Zenduty:
- To add a new Hosted Graphite integration, go to “Teams” on Zenduty and click on the “Manage” button corresponding to the team you want to add the integration to.
- Next, go to “Services” and click on the “Manage” button correspoding to the relevant Service.
- Go to “Integrations” and then “Add New Integration”. Give it a name and select the application “Hosted Graphite” from the dropdown menu.
- Go to “Configure” under your integrations and copy the webhooks URL generated.
In Hosted Graphite:
- Sign In to Hosted Graphite. Go to “Agent” tab to setup your monitoring agent. You can find instructions for the same within the application.
- Go to dashboard and select “Grafana” to see visualization of metrics values. Go to the “Metrics” tab and type * to see all available metrics
- Go to the “notification channel” in alert tab and click “add channel” to add new notification channel.
- Select “webhook” in “notification type” and give name to this channel. Paste the wehook url copied earlier.
- Now, go to “Alerts” and click “add alert” to set the definition of the alert.
- Fill the name of alert, metric to alert on, and message to be sent. Confirm.
- Then set the “alert criteria” and select the notification channel that you have created earlier. Add alerting notification interval. Save.
- Hosted Graphite is now integrated.
Zenduty is a cutting edge incident management platform designed by developers keeping the well-being of engineers in mind. Sign up for free here.


