LogicMonitor Integration Guide
LogicMonitor is a SaaS-based performance monitoring platform that provides full-stack visibility for complex IT infrastructures. It provides charts, graphs, and alerts for your infrastructure when connected to various resources.
What can Zenduty do for LogicMonitor users?
With LogicMonitor's Integration, Zenduty sends new LogicMonitor alerts to the right team and notifies them based on on-call schedules via email, text messages (SMS), phone calls (Voice), Slack, Microsoft Teams, and iOS & Android push notifications.
Zenduty escalates alerts until they are acknowledged or closed, providing your NOC, SRE, and application engineers with detailed context, playbooks, and a complete incident command framework to triage and resolve incidents with speed.
- Incident Lifecycle: Whenever LogicMonitor triggers an alert, Zenduty creates an incident. When the alert is cleared in LogicMonitor, Zenduty automatically resolves the incident.
- Custom Routing: Use Alert Rules to route specific LogicMonitor alerts to specific users or teams, write suppression rules, or auto-add notes.
1. In Zenduty
- To add a new LogicMonitor integration, go to Teams on Zenduty and click on the team you want to add the integration to.
- Next, go to Services and click on the relevant Service.
- Go to Integrations and then Add New Integration. Give it a name and select the application LogicMonitor from the dropdown menu.
- Go to Configure under your integrations and copy the Webhook URL generated.
2. In LogicMonitor: Configure the Webhook
- Log in to LogicMonitor. Navigate to Settings > Integrations.
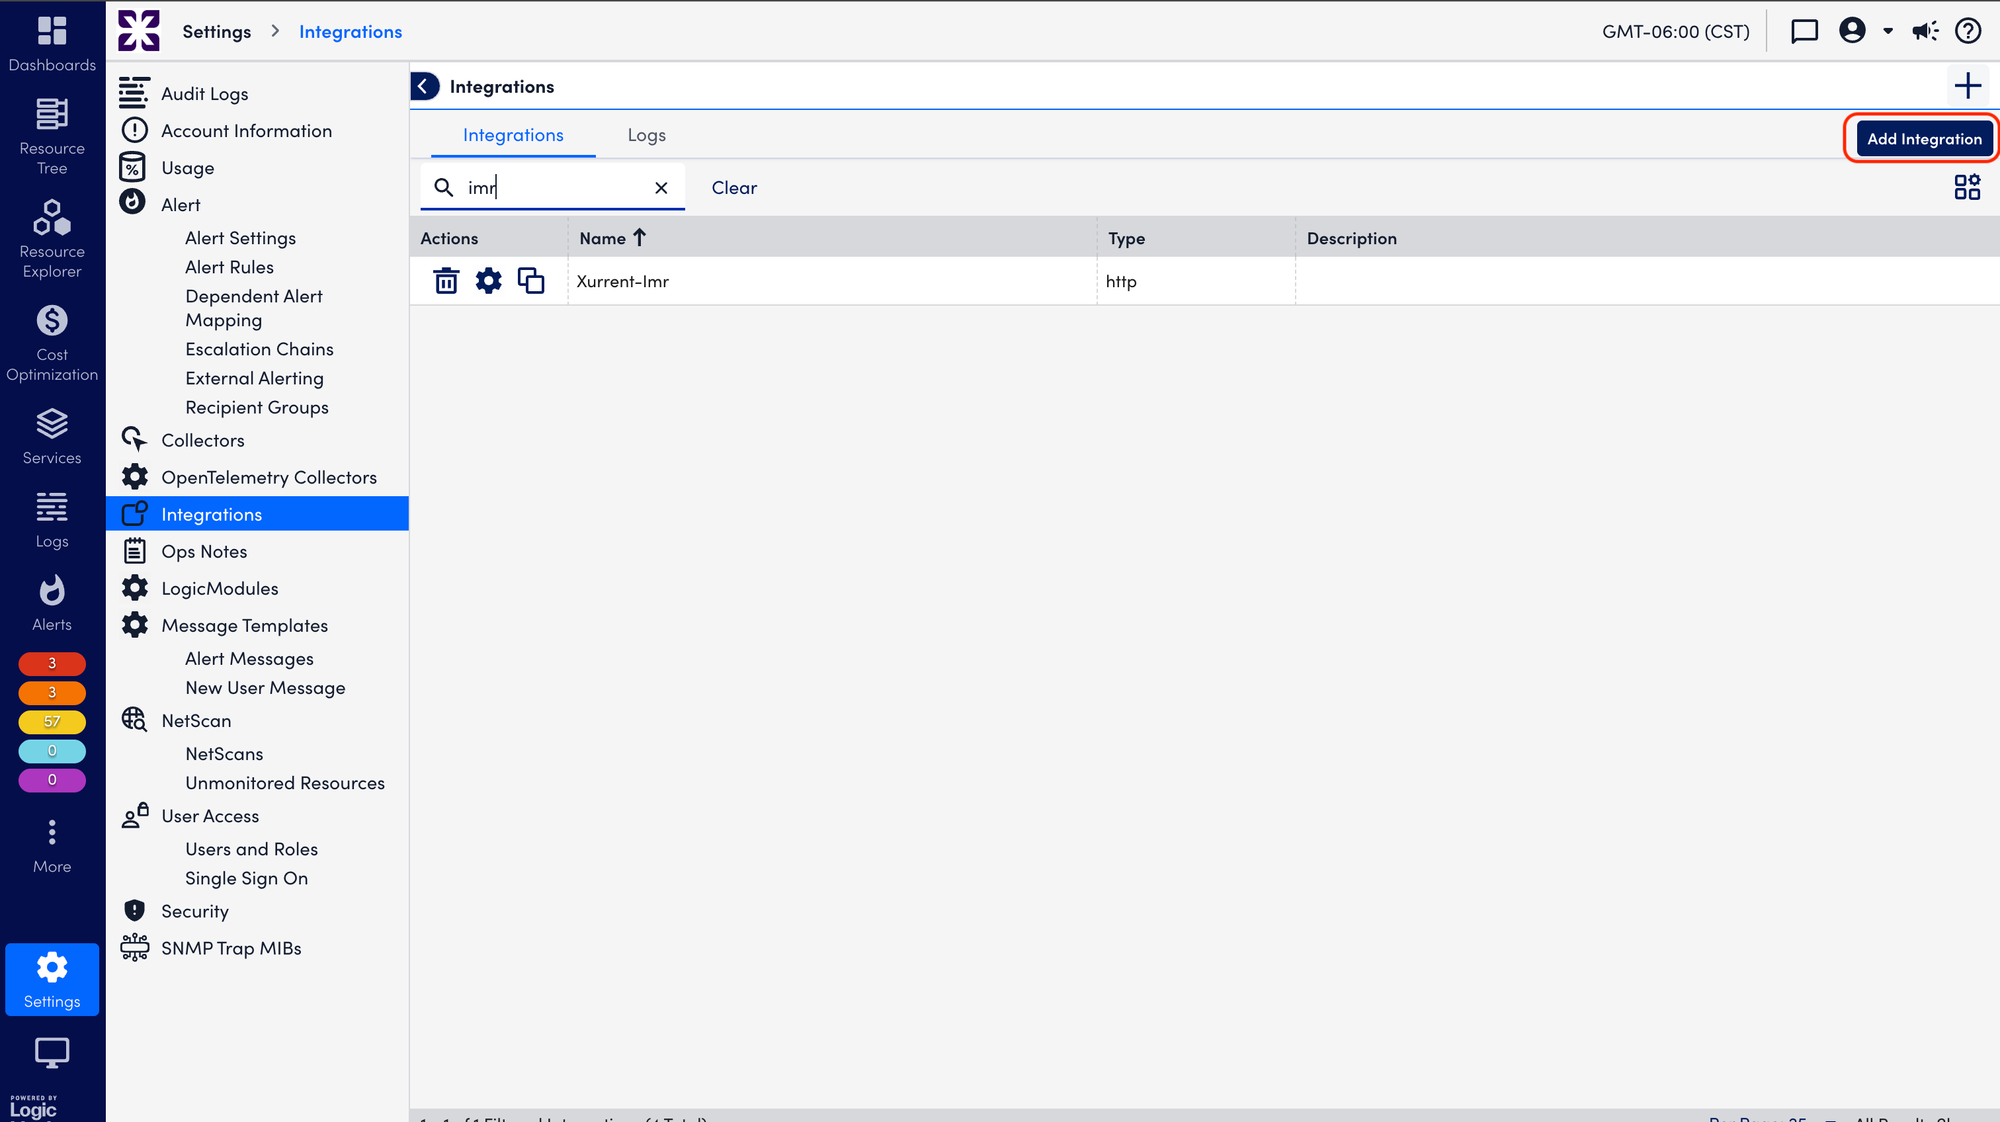
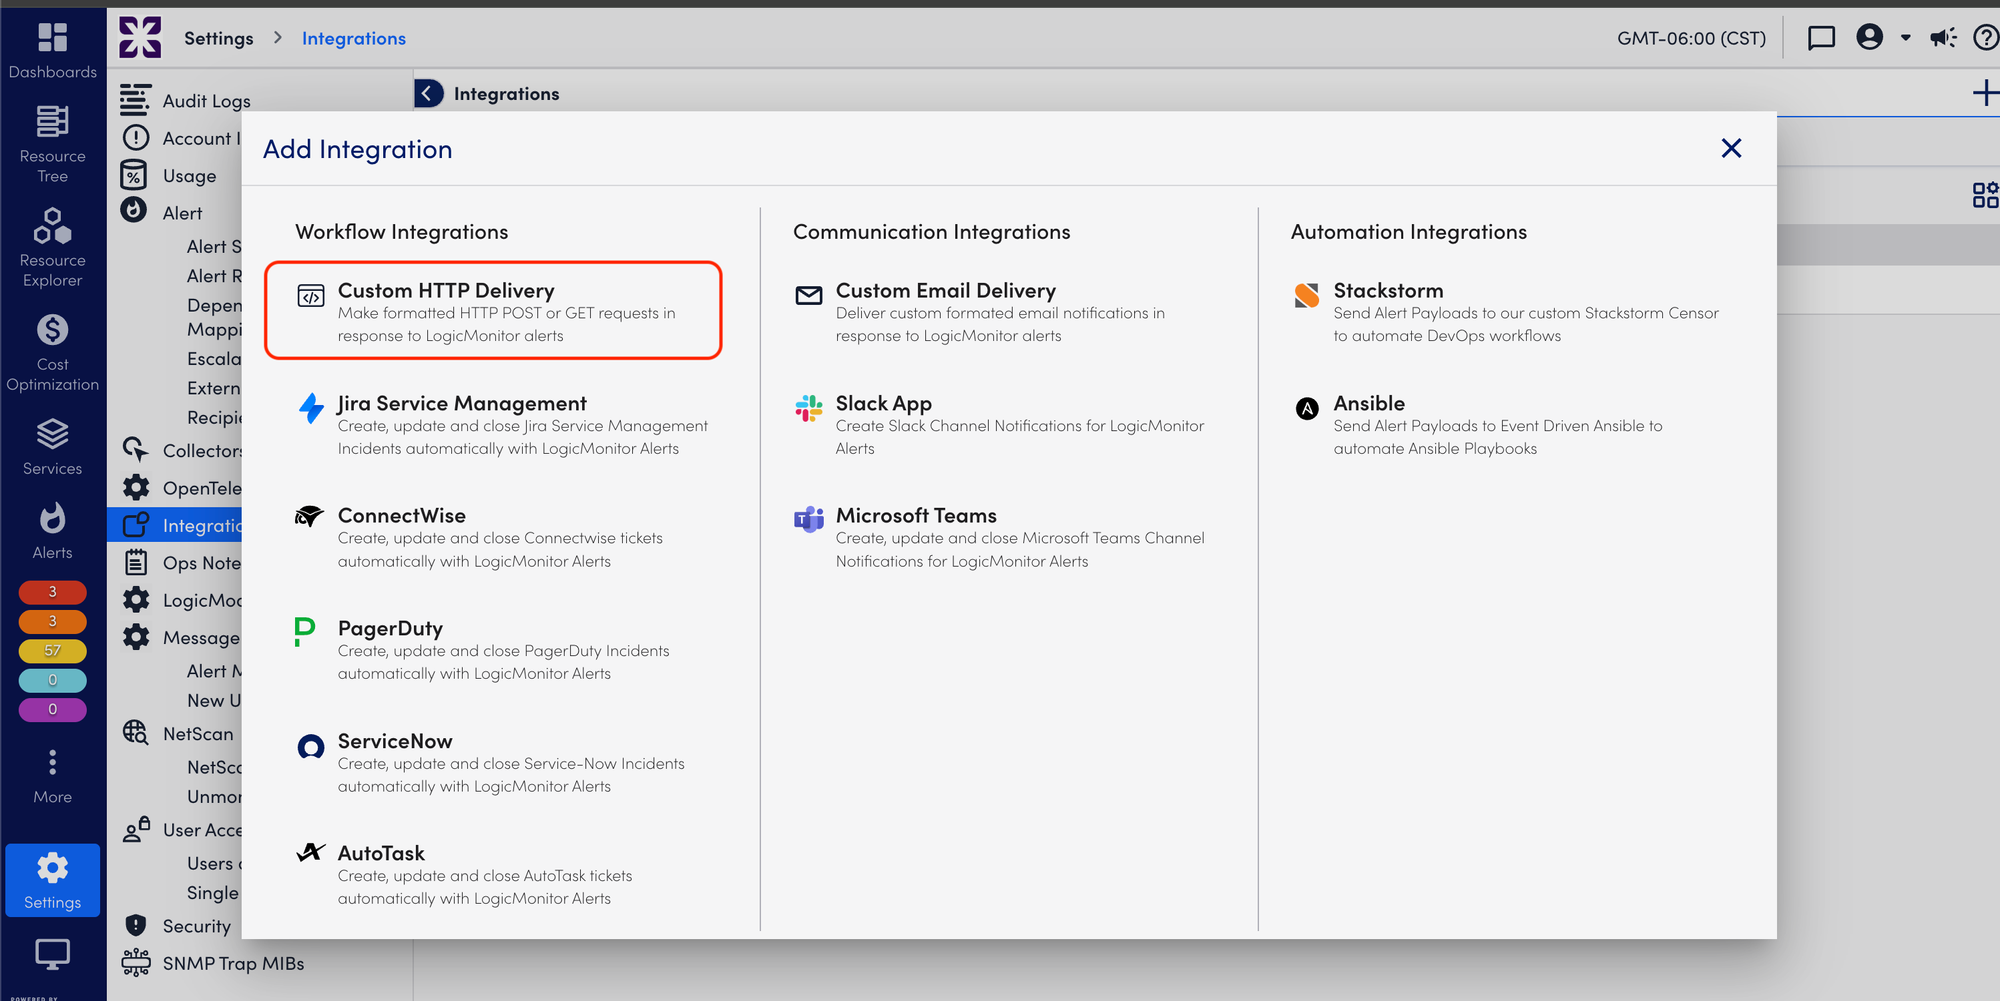
- Click on Add Integration and select Custom HTTP Delivery.
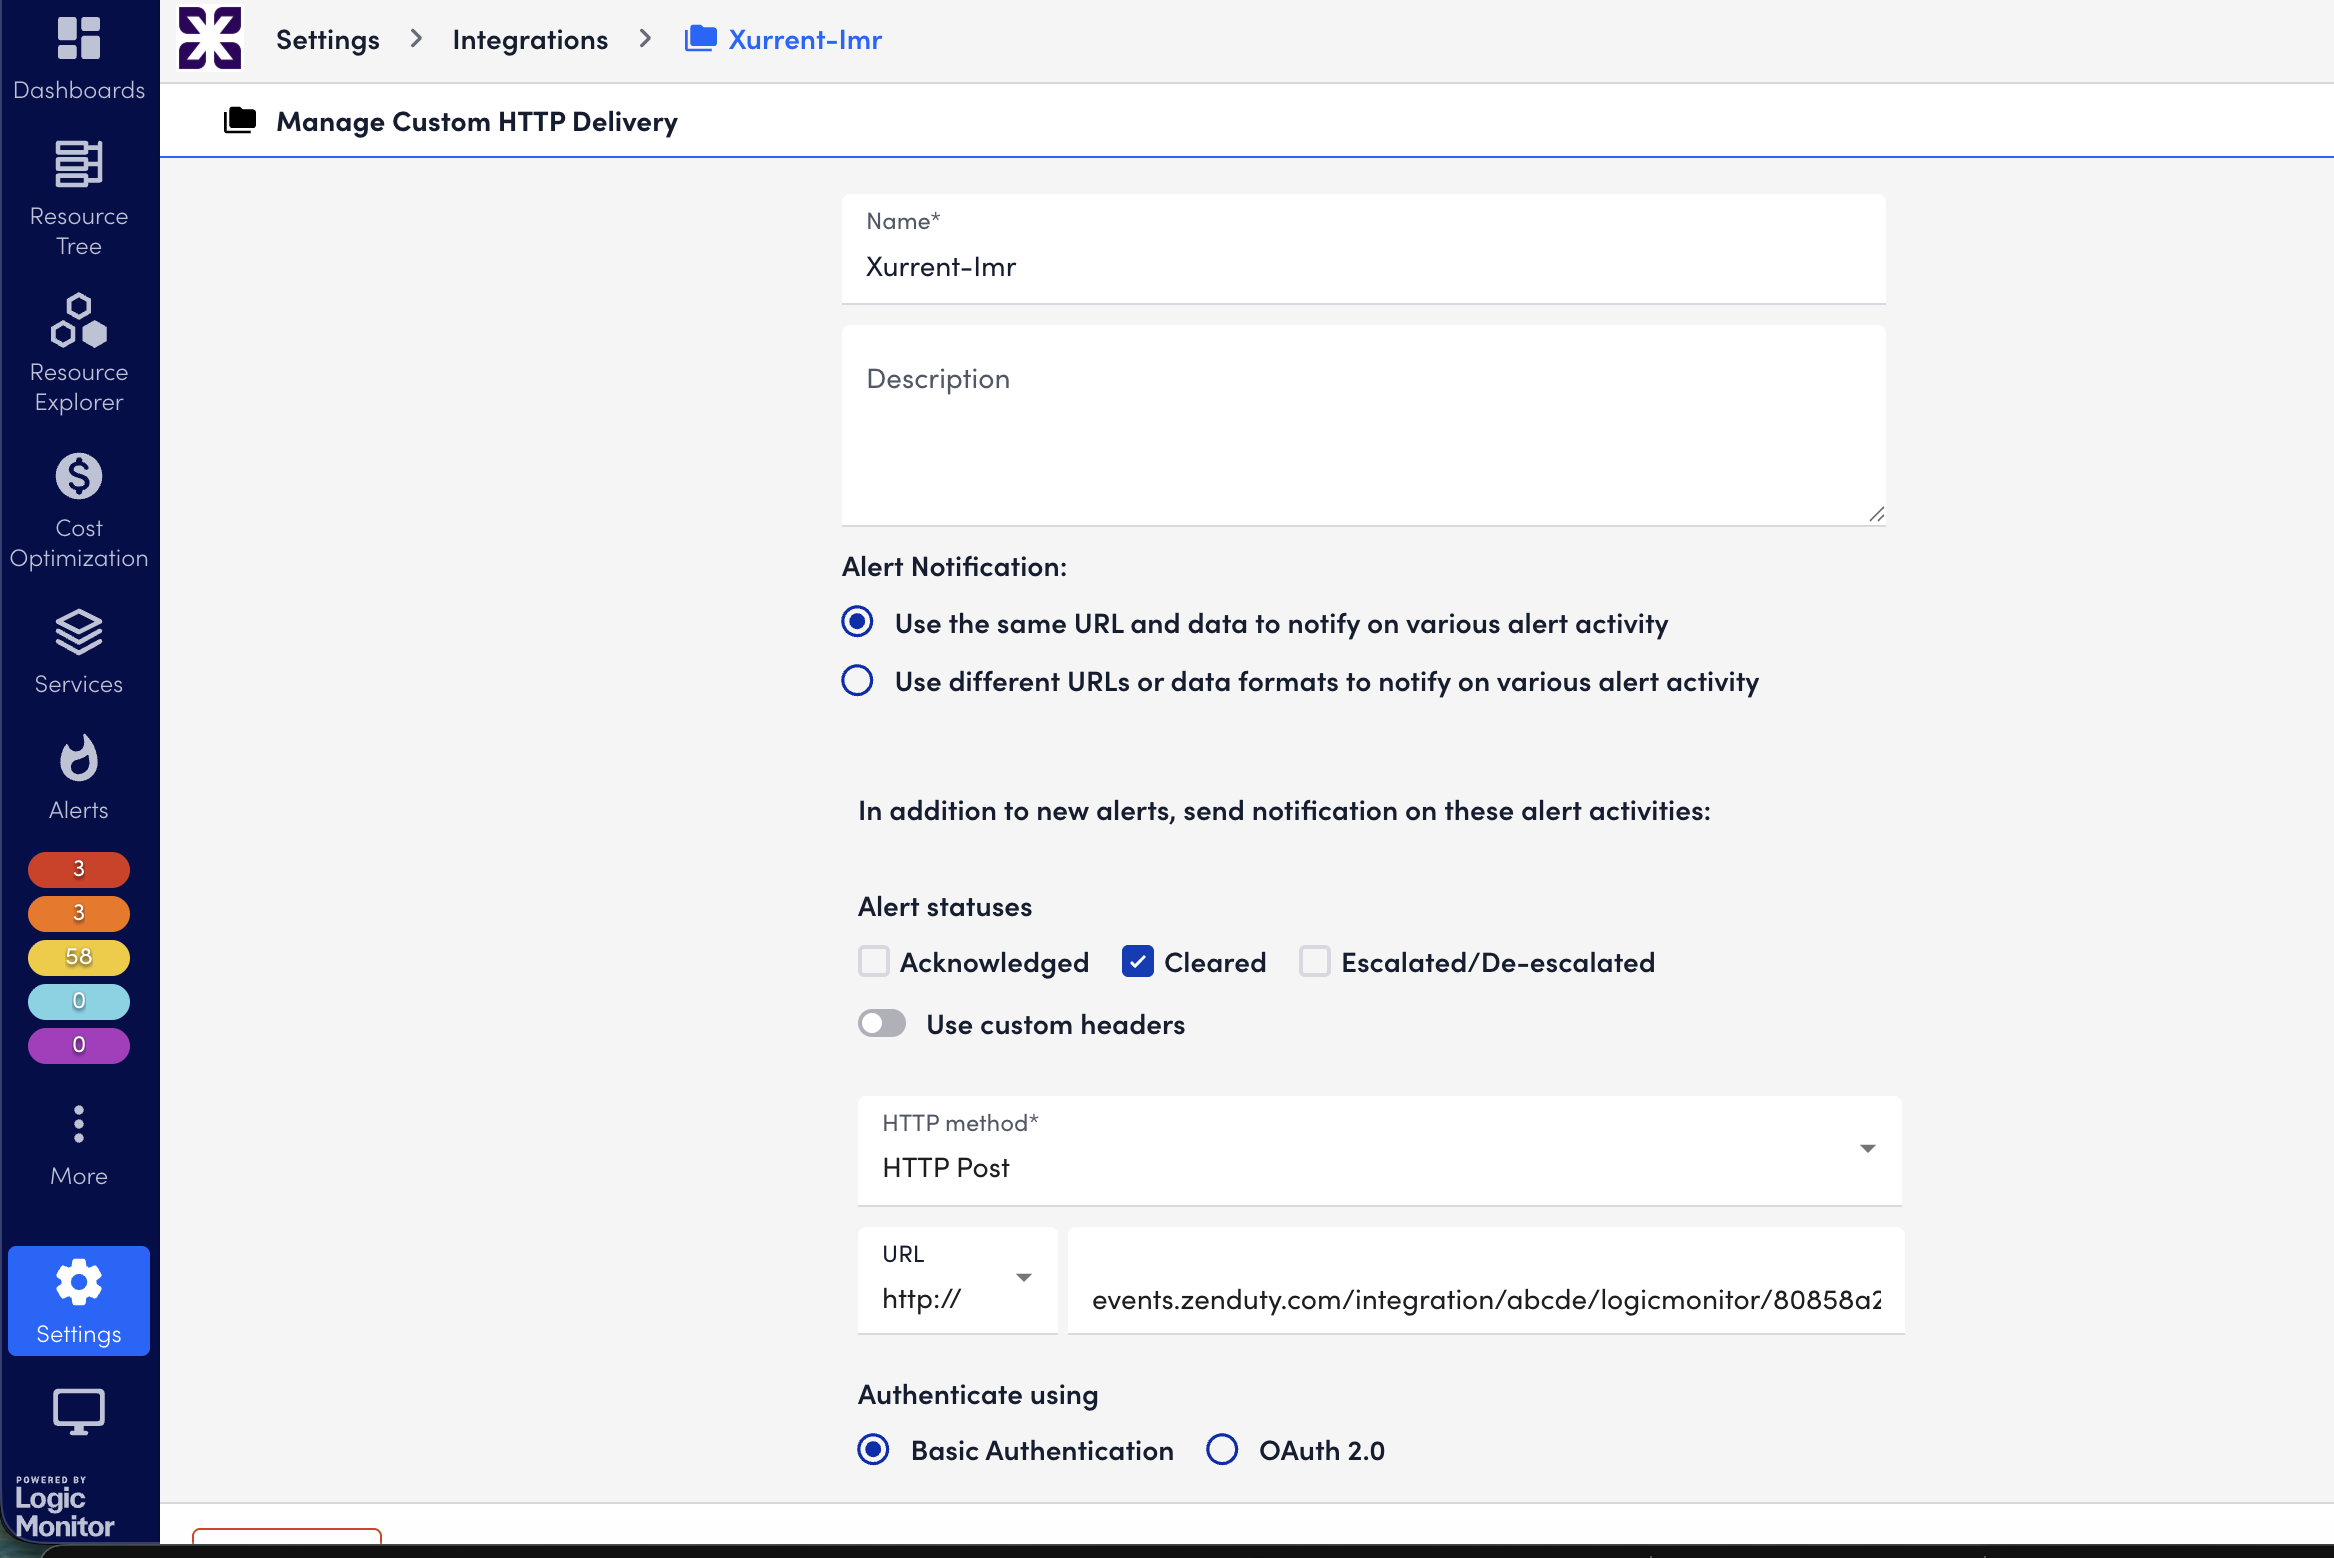
- Fill in the following details in the Manage Custom HTTP Delivery form:
- Name: Zenduty
- Description: Integration to Zenduty Incident Management.
- Alert Statuses: Check Acknowledged, Cleared, and Escalated/De-escalated.
- HTTP method: Select HTTP Post.
- URL: Paste the Webhook URL copied from Zenduty.
- Under Alert Data, select Raw and set the format to JSON.
- Paste the following JSON payload into the box:
JSON
{
  "alert_id": "##INTERNALID##",
  "alert_message": "##MESSAGE##",
  "alert_level": "##LEVEL##",
  "alert_type": "##ALERTTYPE##",
  "alert_status": "##ALERTSTATUS##",
  "data": {
    "subject": "alertseverity:##LEVEL## servername:##HOST## alertname:##DATASOURCE##_##DATAPOINT##_##INSTANCE##",
    "note": "Message from LogicMonitor: \n ``` \n##MESSAGE##\n ``` ",
    "tags": [
      "LogicMonitor Alert",
      "##LEVEL##",
      "##system.azure.resourcename##"
    ],
    "custom_fields": {
      "ci": "##system.azure.resourcename##"
    }
  }
}
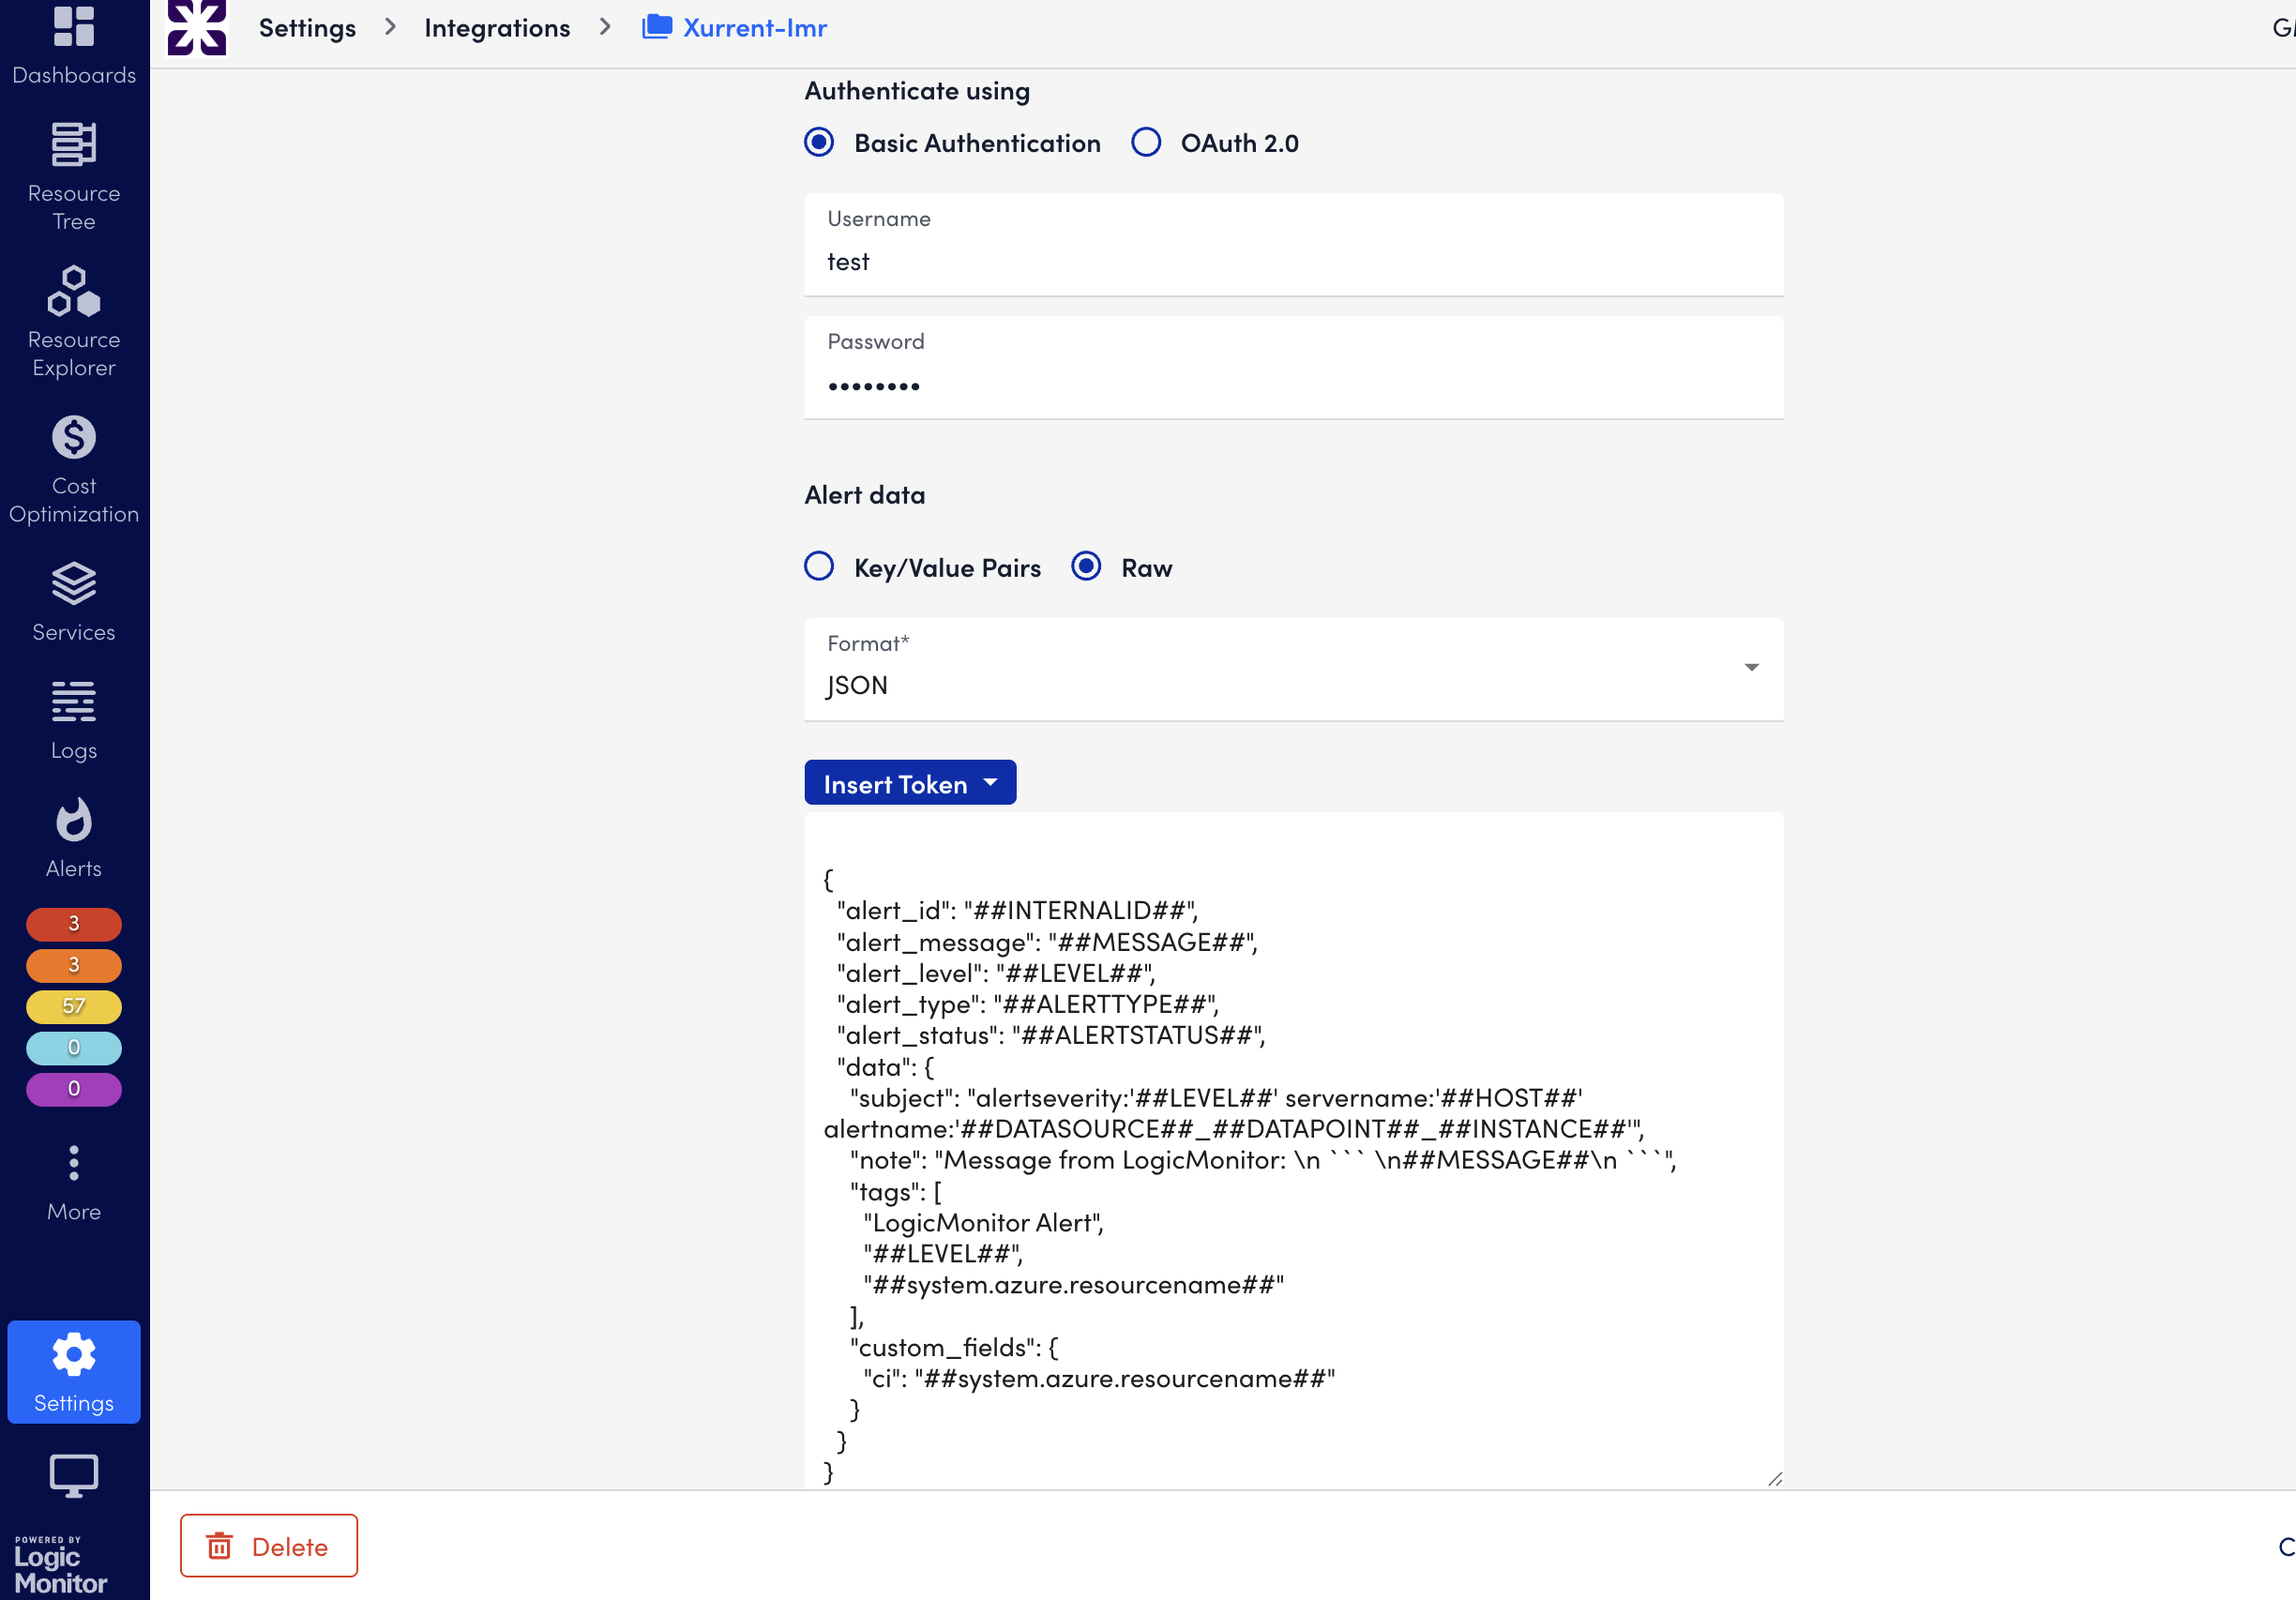
- Click Save.
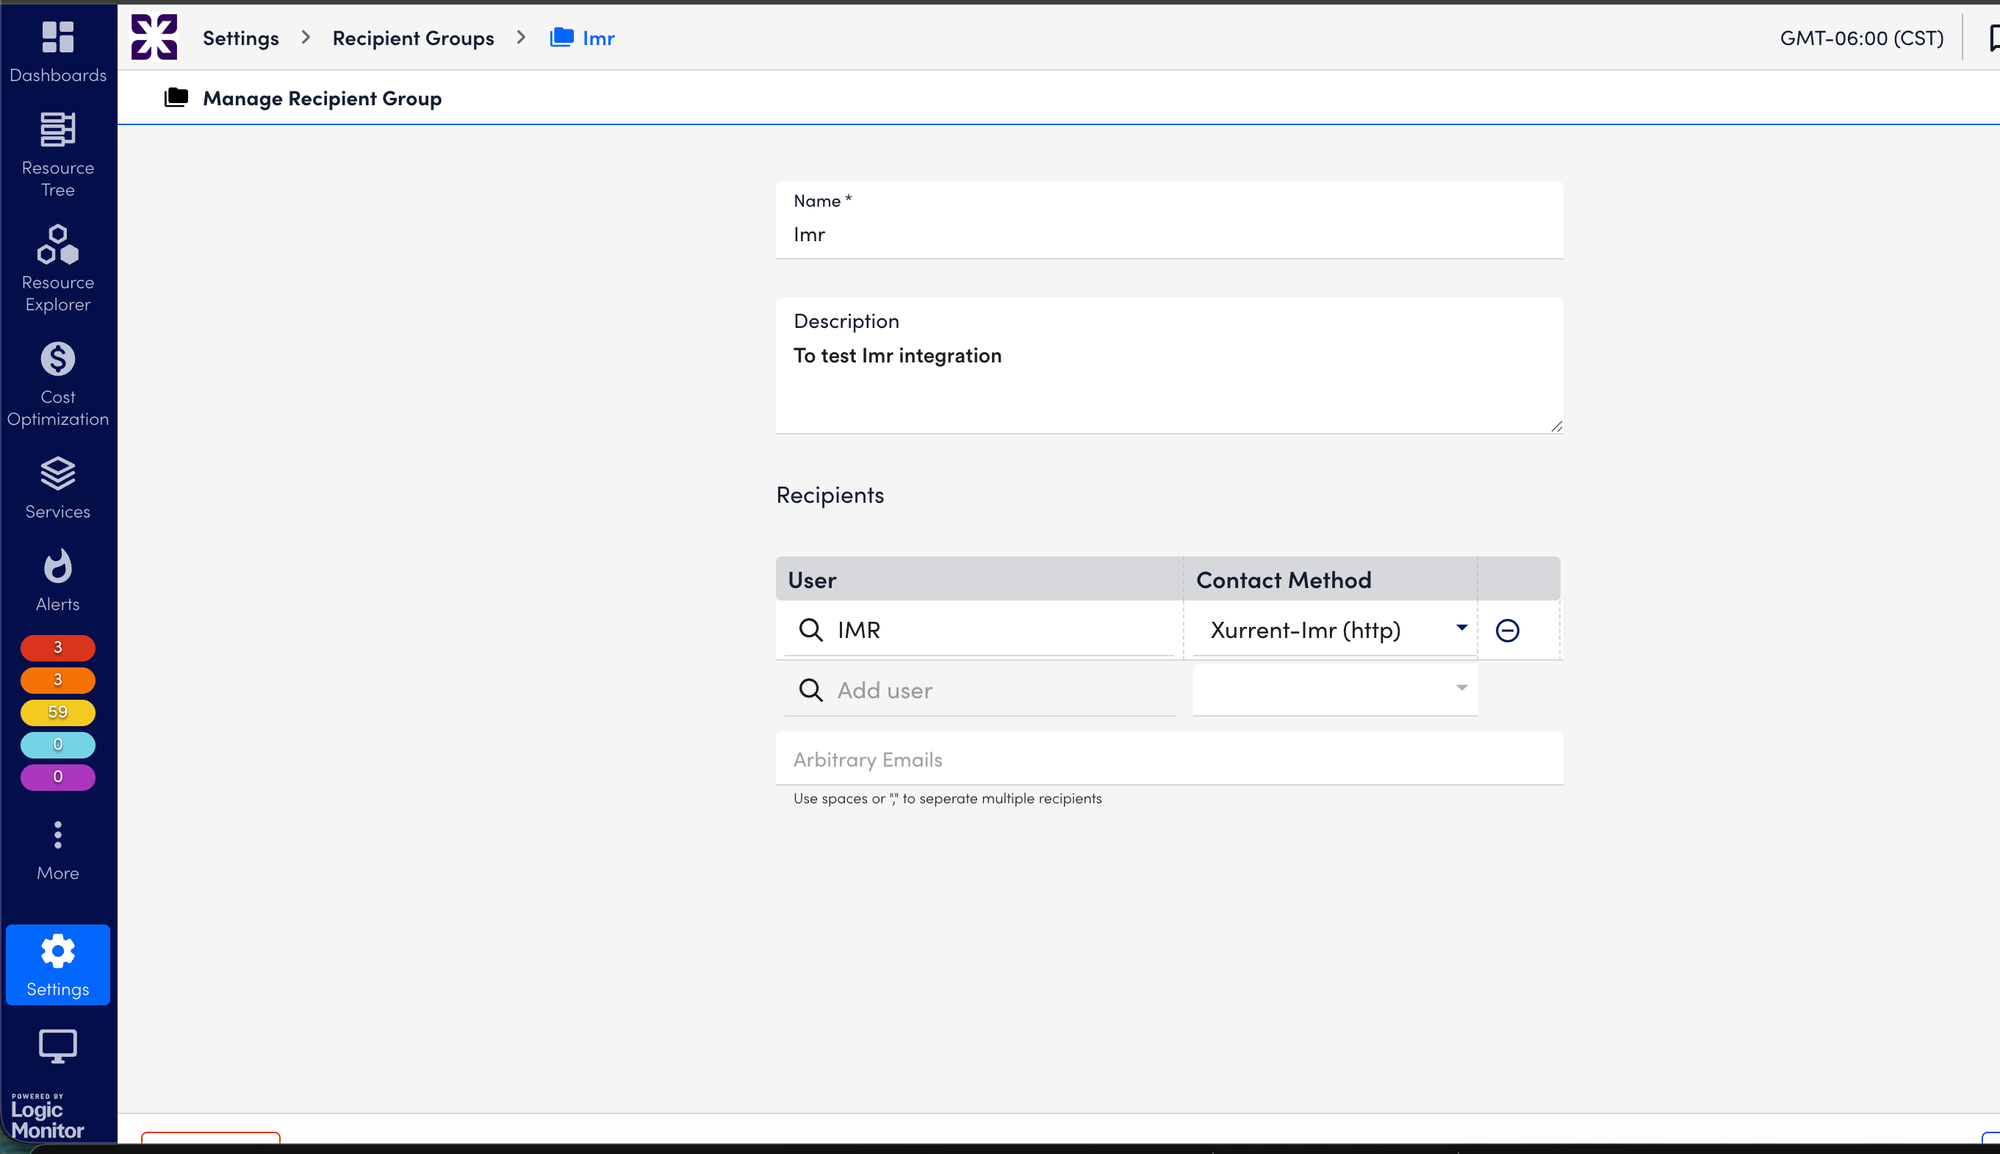
3. In LogicMonitor: Create Recipient Group
- Navigate to Settings > Recipient Groups.
- Click Add Group. Name it accordingly, for example
Zenduty Recipient
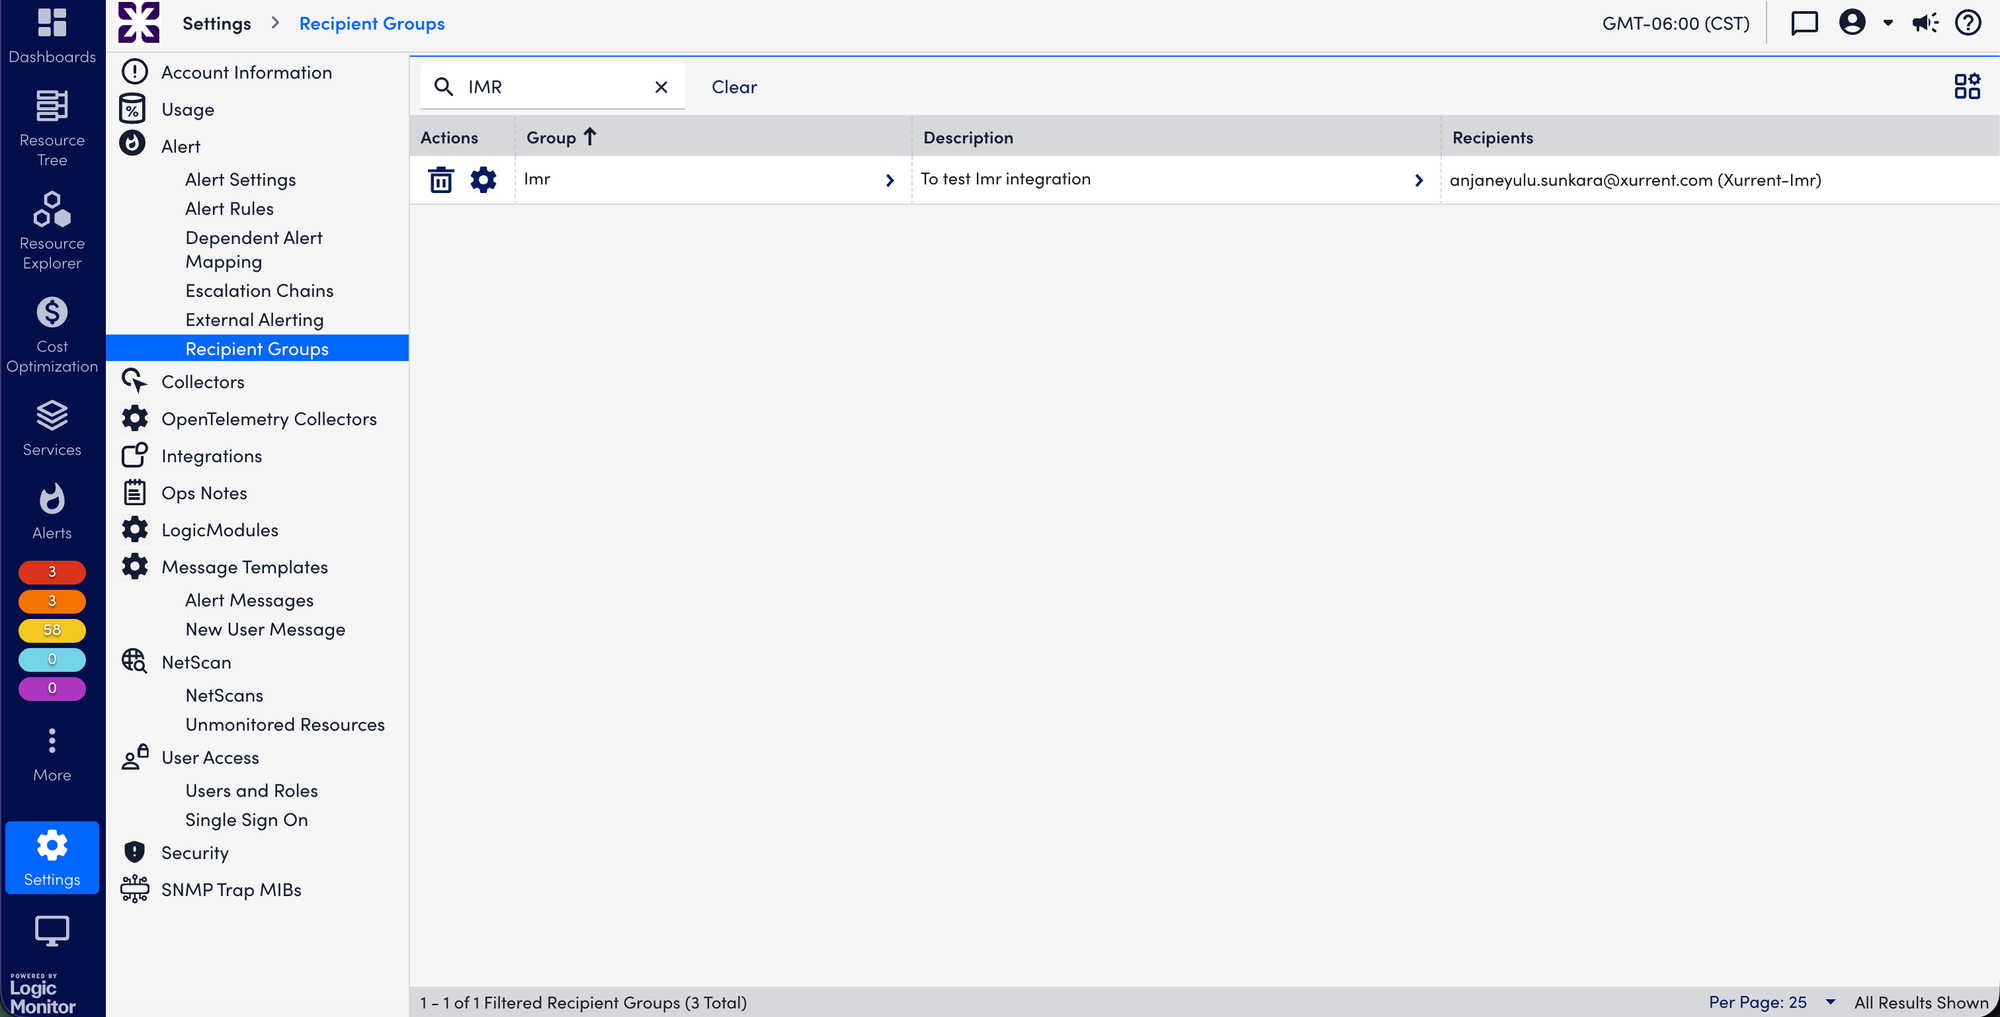
- Under Recipients, search for the "Zenduty" integration you just created in Step 2.
- Ensure the Contact Method is set to your Zenduty HTTP integration and click Save.
4. In LogicMonitor: Set Up Escalation Chain
- Navigate to Settings > Escalation Chains.
- Click Add Chain (or edit an existing one).
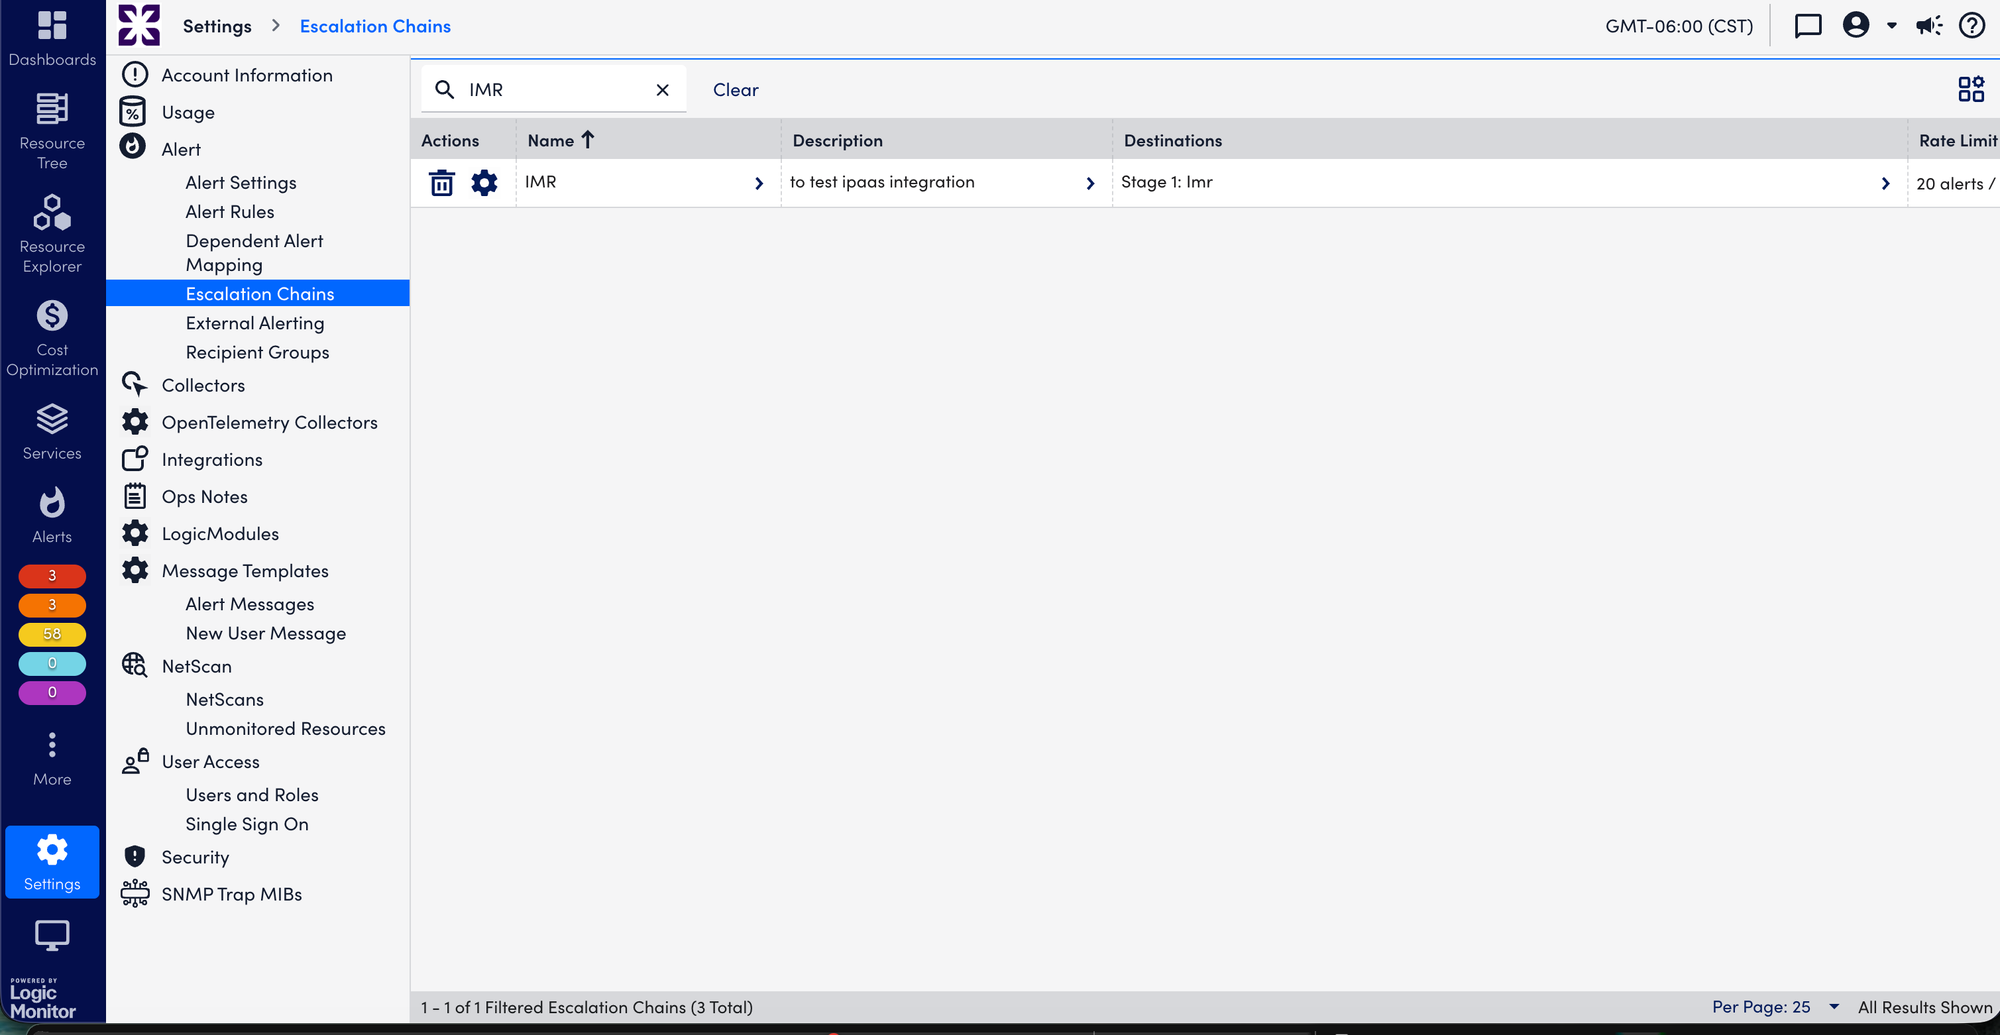
- Give it a name (e.g.,
Zenduty Chain). - In the Stages section, click the + icon to add a stage.
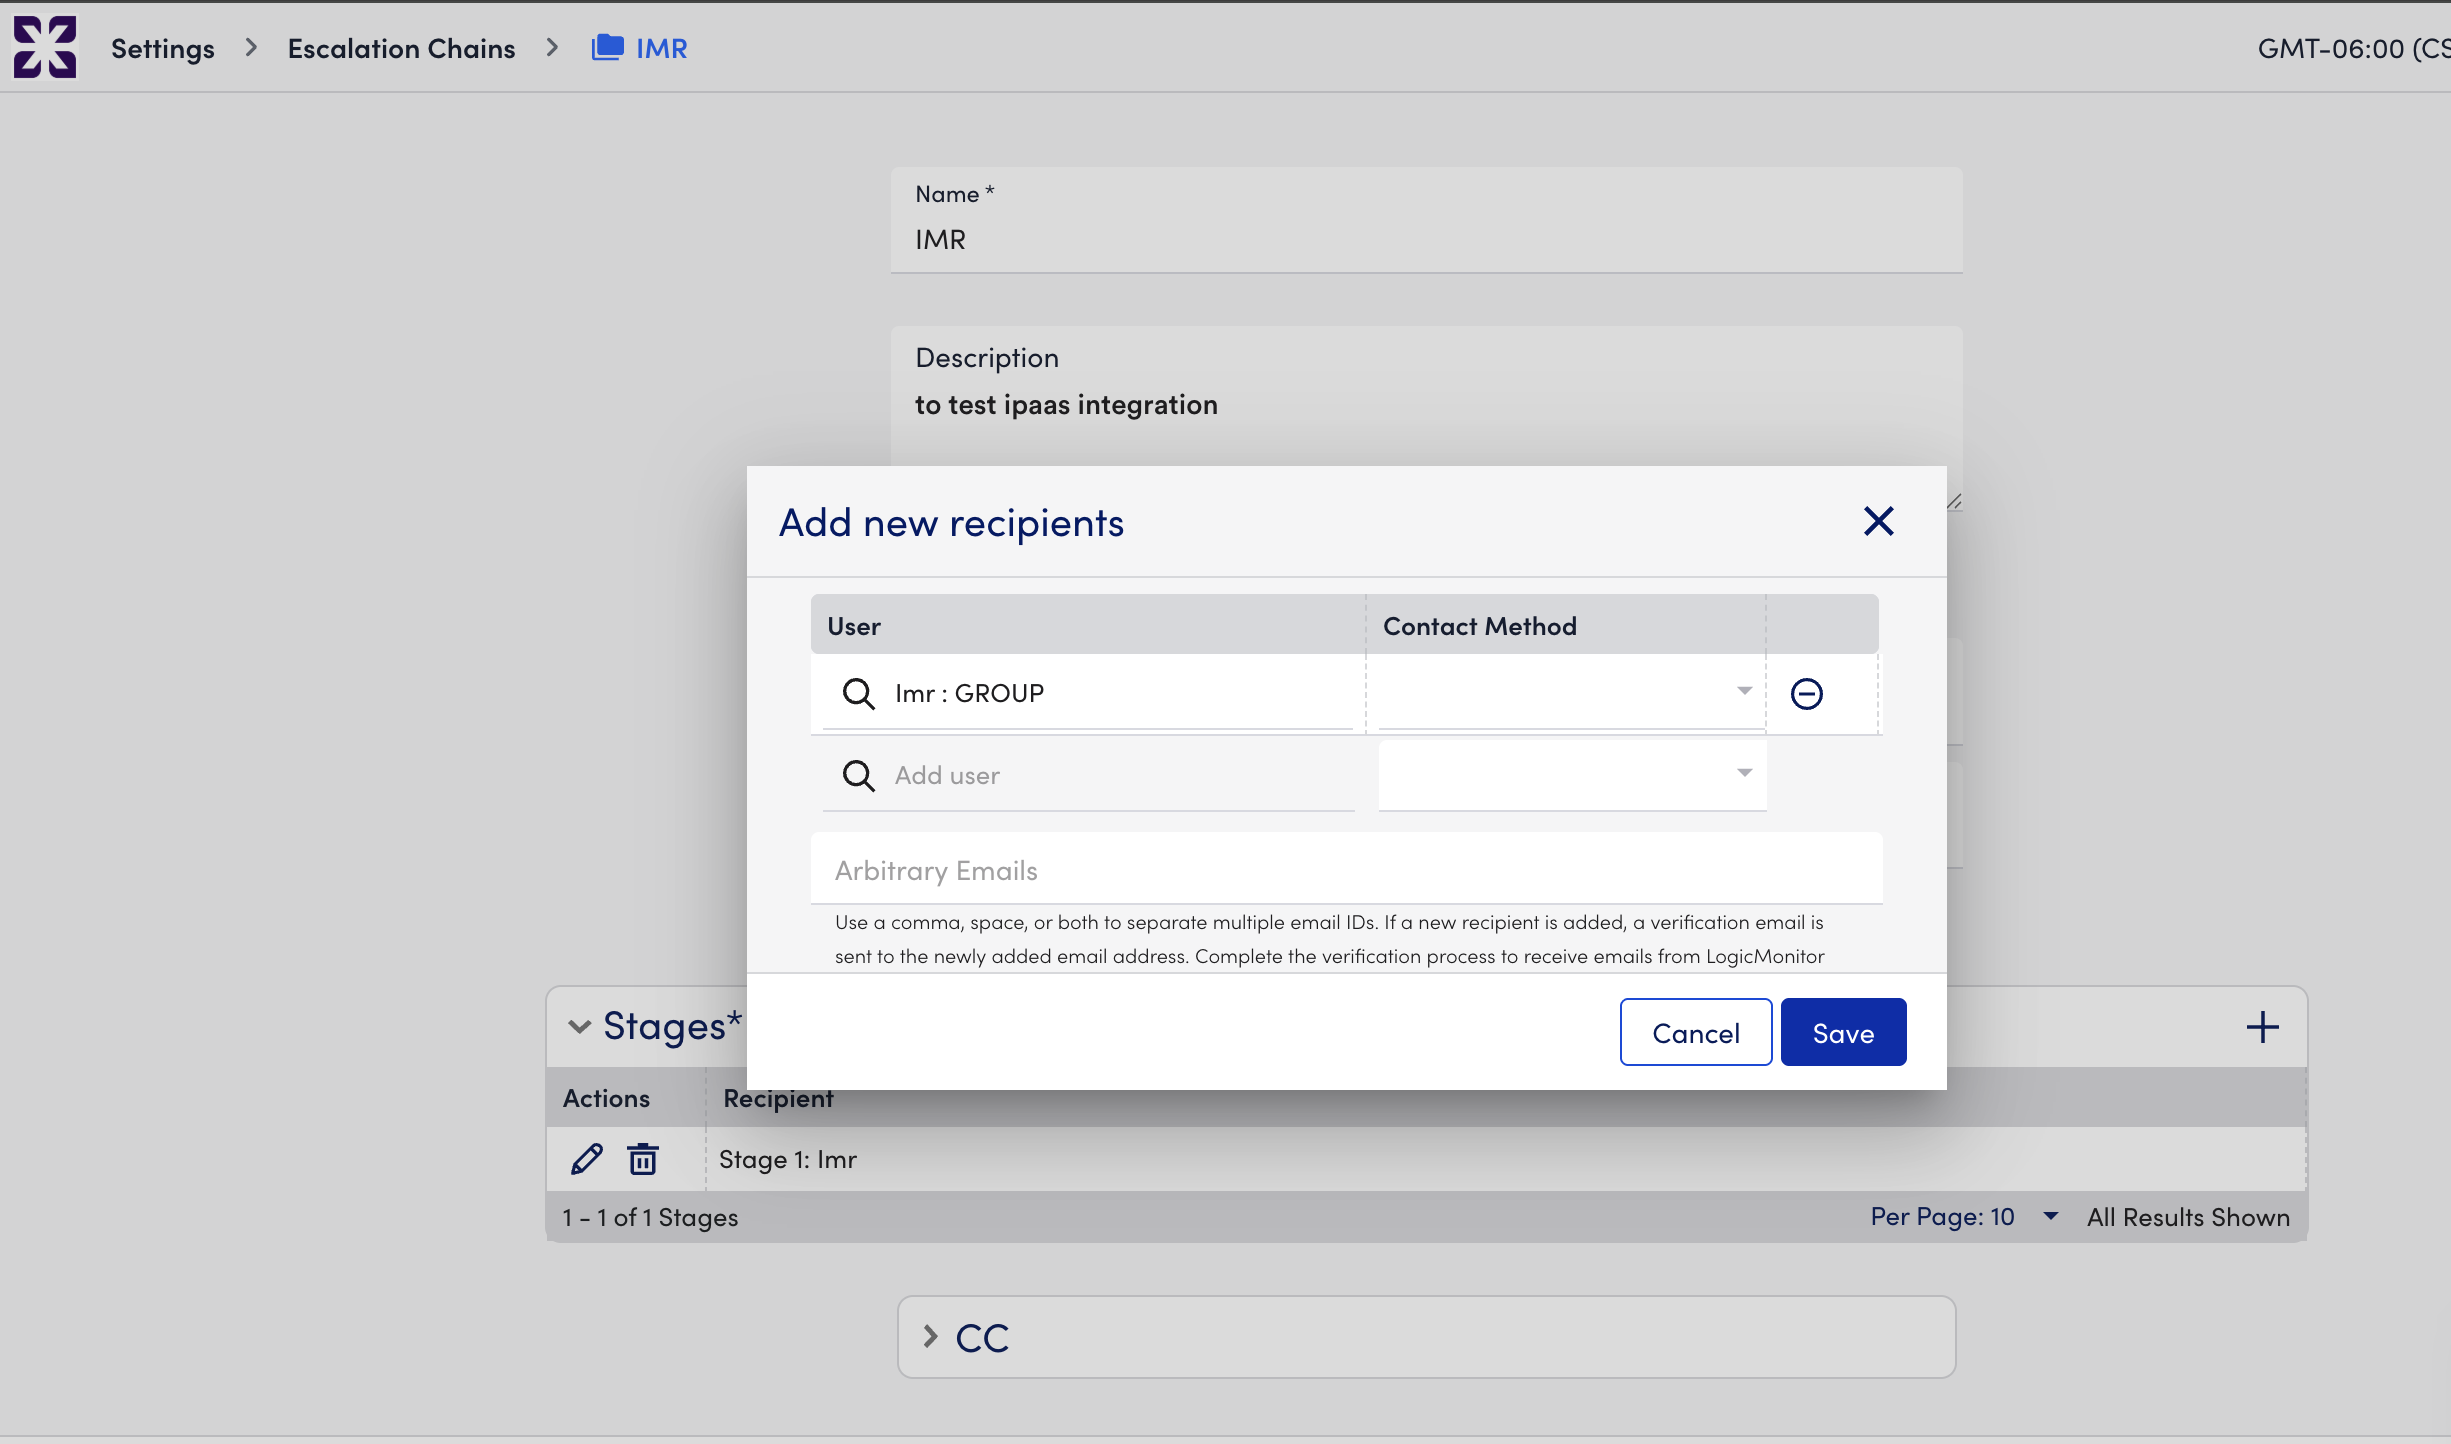
- In the Add new recipients window, search for the
Zenduty Recipientsgroup you created in the previous step and click Save. - Ensure the chain settings (like Rate Limiting) are configured as needed.
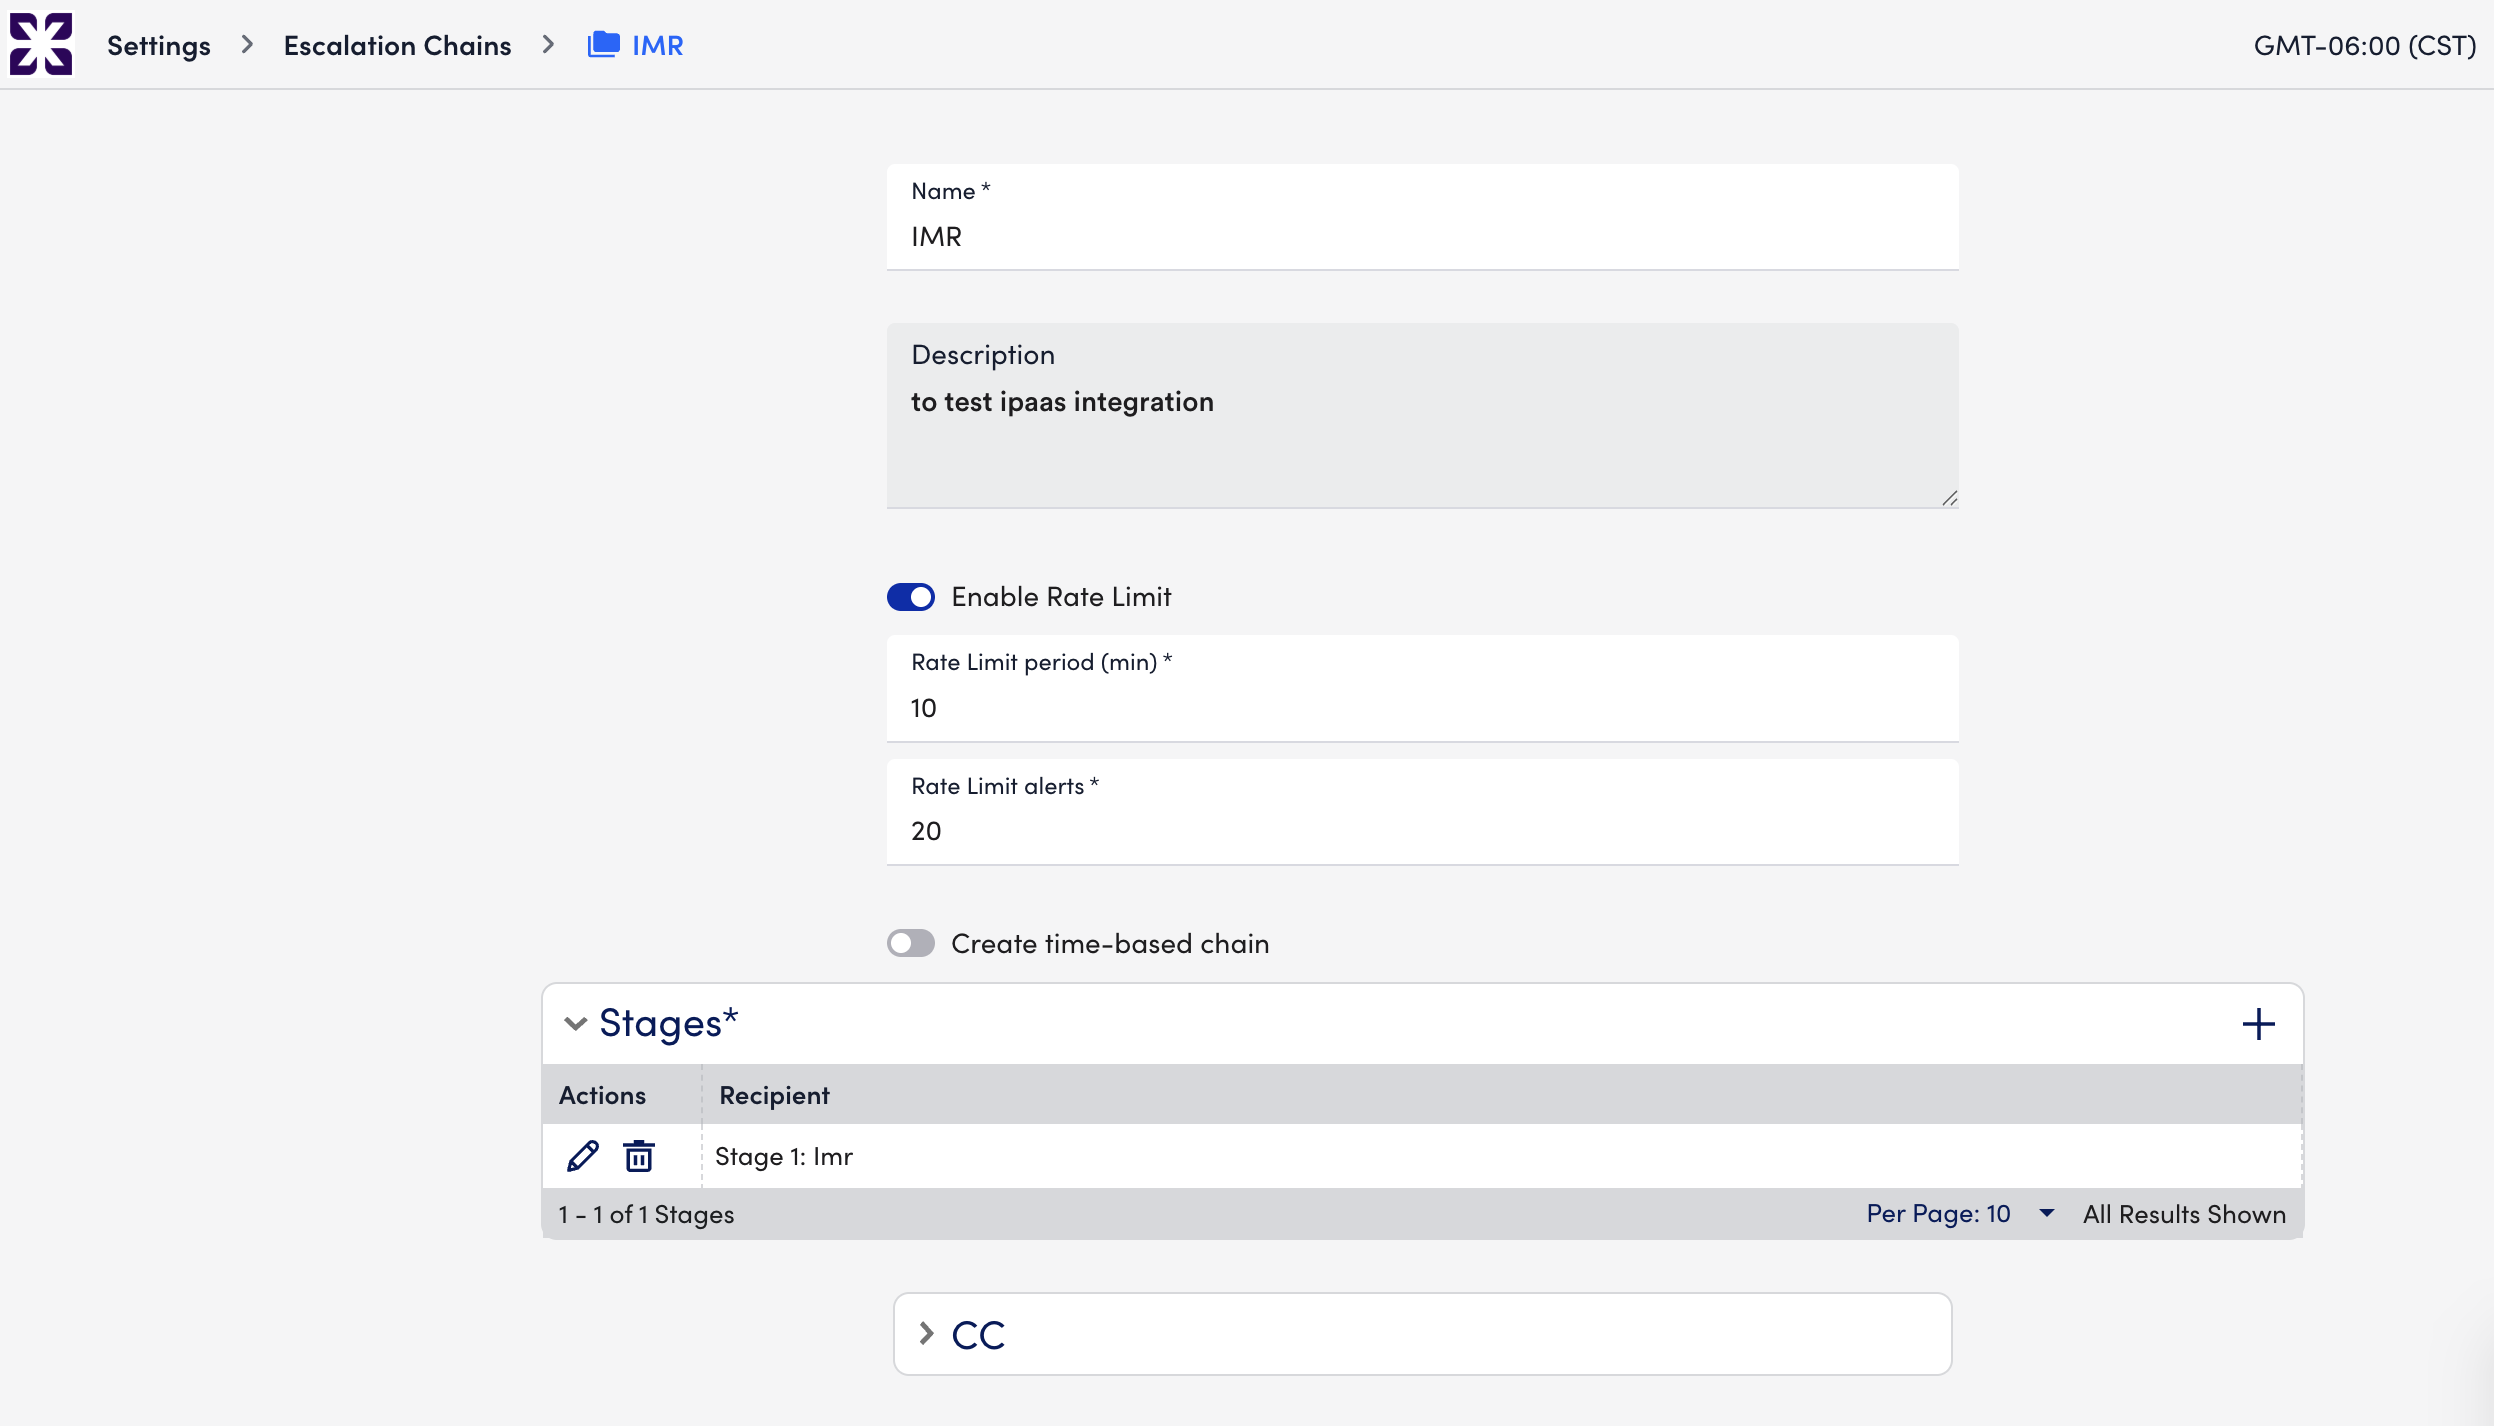
Click Save to complete the chain.
5. Final Step: Link to Alert Rules
- Go to Settings > Alert Rules.
- Select the rules for the resources you want to monitor.
- In the Escalation Chain dropdown, select the
Zenduty Chainyou created. - Save the rule.
LogicMonitor is now successfully integrated. Zenduty will automatically create and resolve incidents based on your LogicMonitor alerts.